You’ve Hit Rockbottom


This weekend, the stock and crypto market experienced a catastrophic decline, with Bitcoin plummeting below the critical $50,000 threshold, triggering mass liquidations and panic selling.
As fear grips investors, the major question remains: Is the fall over? Or are we in for a wild ride?
In this issue of our newsletter, we’ll be discussing the current market events.
We'll get you updated, hear expert opinions, and learn how you can protect your money.

💀 Companies Shudder as Market Loses Over $1 Trillion Dollars
The mega-cap tech giants that once ruled the market are now facing a harsh reality, as a stunning $1 trillion vanishes in a devastating market downturn. Can they recover quickly?
📉 Dow Stock Plunges Amidst Fear of US Economy Slowdown
Wall Street woes deepen as the Dow and S&P 500 tumble, wiping out gains and leaving investors on edge. What’s driving the downturn?
🧠 What Should You Do During A Market Sell-Off?
The current market selloff has left investors reeling, but experts advise against making emotional decisions. Instead, focus on these key strategies to ride out the storm.
📝 The Hottest Dividend Stocks To Buy Right Now
Looking for steady income and explosive growth? Discover the 7 best dividend growth stocks to buy now, expertly curated for maximum returns.
❌ Bitcoin Speculators Suffer $850M Losses as Price Plunges Below $50K
A staggering $850 million wiped out in a flash! Bitcoin speculators feel the pain as the crypto giant's price crashes below $50,000. What triggered the massive losses?
💥 Crypto Crash; The Beginning of the End?
The cryptocurrency market is shaking as Bitcoin's value nosedives, sparking fears of a broader downturn. Can Bitcoin recover from this downturn?
🥶 “Don’t Panic Yet” Economists Advise Stock Traders
While fear grips the market, top economists are quietly placing their bets, urging traders to stay calm and focus on these alternative strategies. Discover the strategies top economists are betting on.

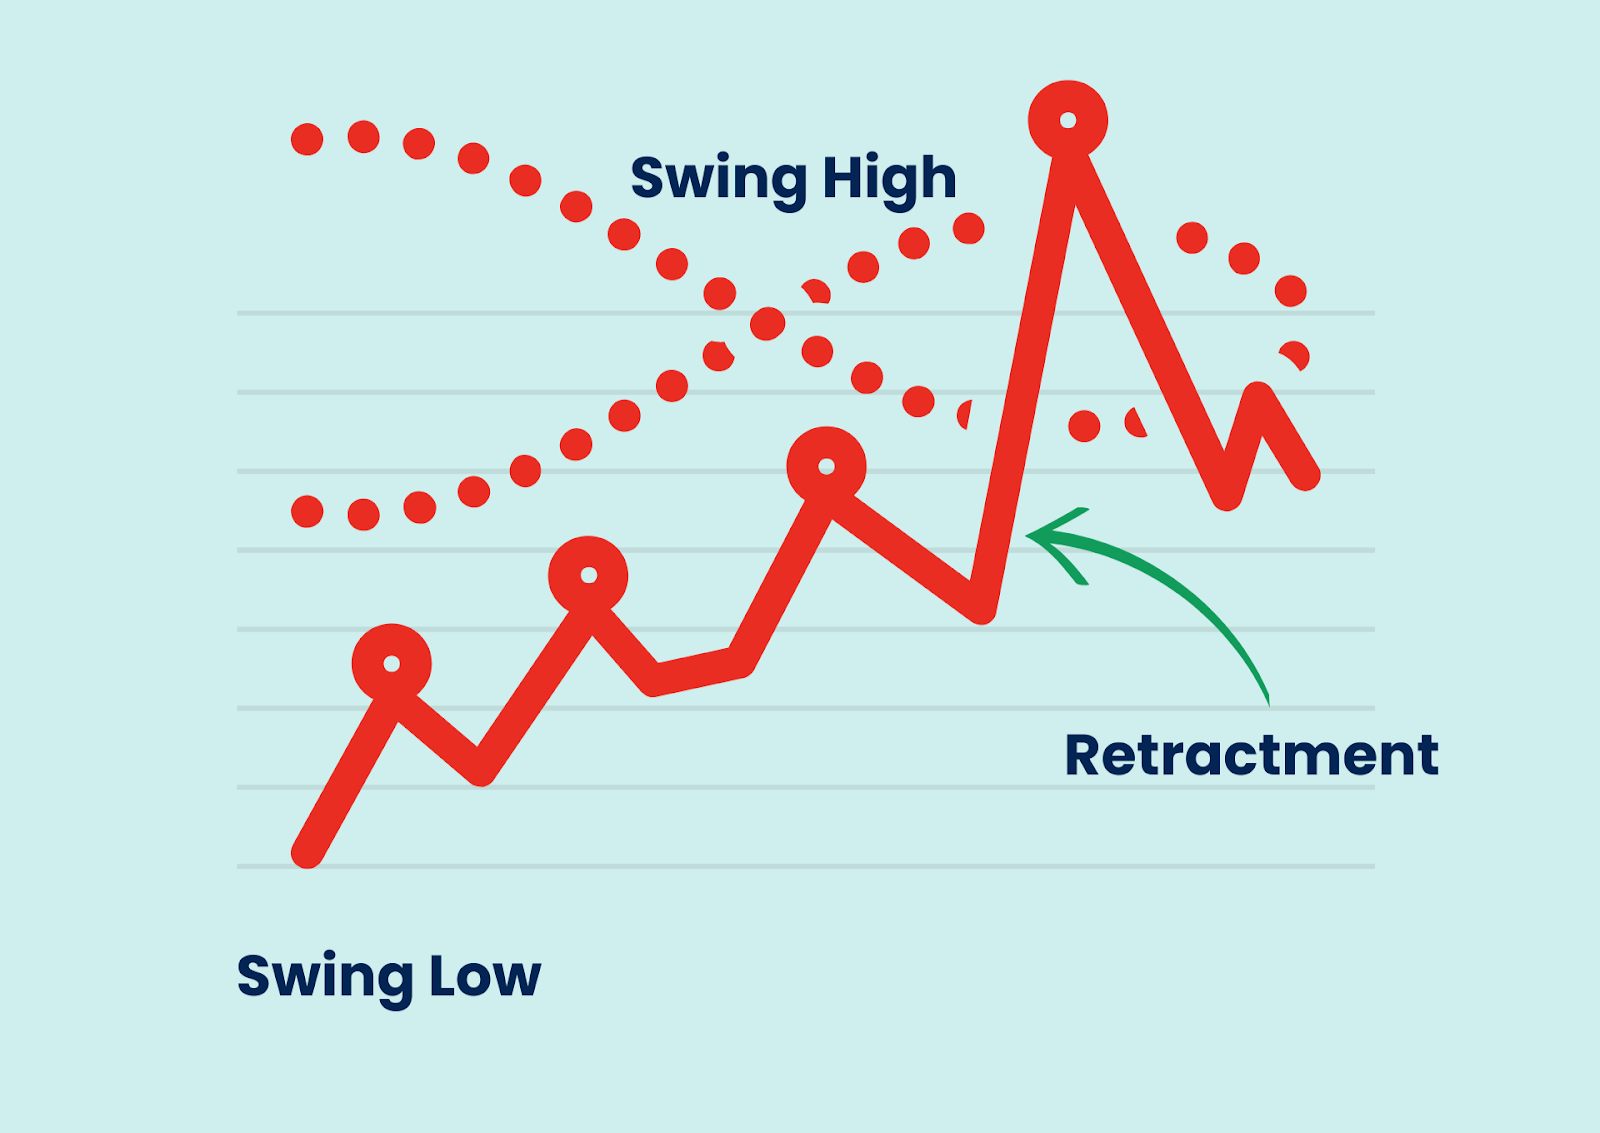
Fibonacci Retracement

Fibonacci retracement is a tool that helps traders find levels of support and resistance in the market.
It's based on a special sequence of numbers that create ratios like 23.6%, 38.2%, and 61.8%.
How Does it Work?
Traders draw these ratios on a chart between a high and low point. These levels often act like "pause" or "reverse" buttons for prices.
What to Look For:
- Retracement Levels: The most important levels are 38.2%, 50%, and 61.8%. These can act like support or resistance areas, where you might want to buy or sell.
- Confirmation: Look for other signs, like candlestick patterns, to confirm that the Fibonacci levels are important. This can help you make a stronger case for a trade.

Let's talk real for a second.
We've all been there - feeling on top of the world one minute, and then completely lost the next.
It's like trading is a rollercoaster with no safety harness.
I've met countless traders who are incredibly smart, have the best tools, and yet still struggle.
Why?
Because trading isn't just about charts and numbers.
It's a mind game. Your brain is your biggest asset, but it can also be your biggest enemy.
See it as a valuable asset that could help you stay calm during market chaos, make smarter decisions, and even boost your profits.
That's what understanding your trading psychology is all about.
In the coming weeks, we’re going to dive deep into this often-overlooked area.
This newsletter will continue to share practical tips, real-life stories, and strategies to help you MASTER YOUR MIND.
Trust me, it’s going to be a game-changer.


