(Revealed) Truth Behind The Market Crash 😭


Market meltdown or mere correction?
The Japanese Nikkei is doing better than expected, and even Warren Buffett is buying stocks.
Let’s cut through the fear and find out what’s really going on.

🇯🇵 Japanese Nikkei Fights Backs as Stock Rebounds After Market Crash
Japan's Nikkei 225 index makes a remarkable comeback, defying expectations. What's driving the sudden surge?
👴 Veteran Investor Warren Buffett Ditch Apple For The New Stock
Warren Buffett shocks investors by selling Apple stock! What's behind this surprising move, and which mega-cap stock is he betting on now?
⚖️ Apple in Big Trouble As Google Loses Antitrust Suit
Google's antitrust loss could cost Apple billions. Find out how the tech giant got caught in the crossfire.
💾 Nvidia Stock and Others Suffers After AI Chip Delay
Nvidia's delay in releasing its cutting-edge AI chip has sent shockwaves through the tech industry, punishing hardware partners and Nvidia's stock. See what’s causing the delay.
📝 Scared Money Won’t Make You Rich; Here’s Why
A financial planner cautions against 'scared money' and shares strategies for smart investing. Useful insights are in here that you should not miss!
🔴 $3 Trillion Market Cap Evaporates, But Here's the Silver Lining
A staggering $3 trillion in market capitalization has vanished, leaving investors panicking. However, beneath the surface, a promising trend emerges.
⏫ These 3 Blue-Chips Show Promising Returns After Q2 Earnings Boost
Strong Q2 earnings have taken these 3 blue-chip stocks to new heights. Are you positioned to capitalize on their momentum?

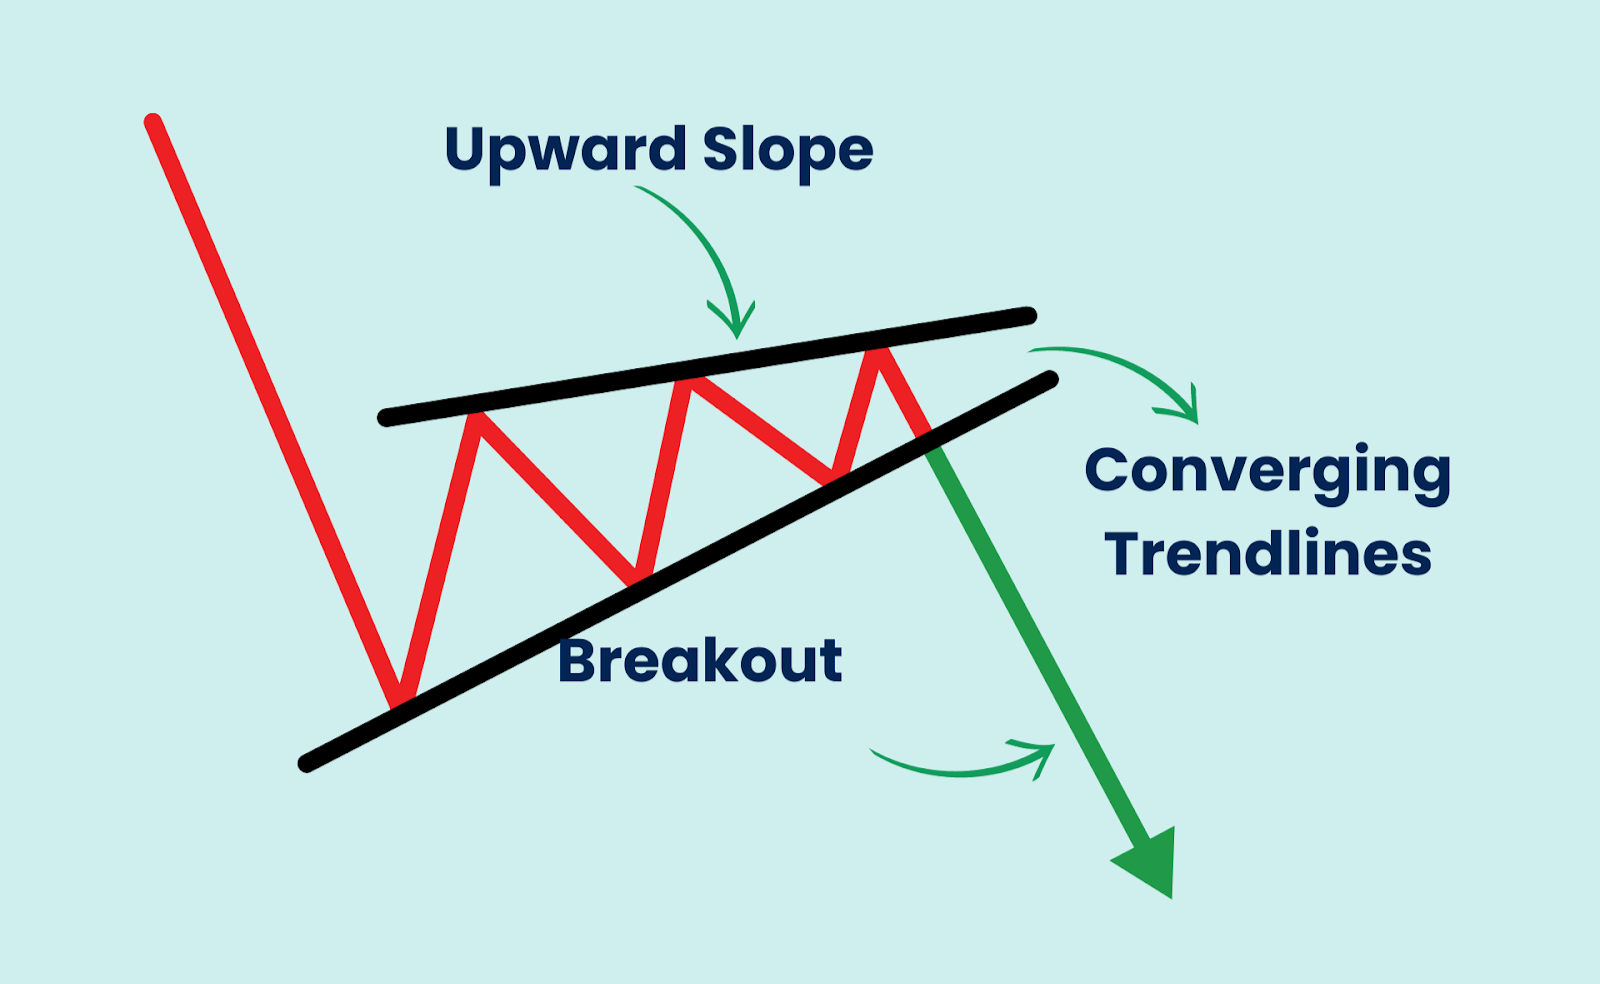
Rising Wedge

The rising wedge is a bearish reversal pattern, suggesting that an upward trend is losing momentum and could soon reverse into a downtrend.
It's like the market is trying to continue climbing higher, but the buyers are becoming exhausted, and sellers are starting to gain control.
What to Look For:
- Upward Slope: The overall trend of the wedge should be sloping upwards.
- Converging Trendlines: The upper and lower trendlines should be moving closer together, forming the wedge shape.
- Breakout: The pattern is confirmed when the price breaks below the lower trendline, often with increased volume. This signals a potential reversal and the start of a downtrend.

Before we dive into today's topic, I want you to watch this short video.
What’s the lesson?
To help you, let’s run it back.
Imagine you're running a casino.
All the lights, the excitement, the money.
Everything seems to be just right financially.
But let's get real for a second.
Behind the scenes, there are bills to pay. Electricity, staff salaries, games, and taxes – it all adds up. Even with people winning big, you gotta keep the place running smoothly.
Trading is kind of like that.
You see, trading isn't just about buying low and selling high.
It's tempting to think it's all about making money, but there are costs involved.
Things like trading fees, software, and even learning how to trade can take a bite out of your profits.
It's not as glamorous as it seems.
It's like any other business - you gotta spend a little to make a lot.
If you’re a newbie, it’s completely normal to experience this as you start your trading career.
By understanding your expenses, you can make better decisions and protect your hard-earned cash.
So, embrace those costs and turn them into a positive!
After all, every cloud has a silver lining, right?


