Alphabet Stock Nears Record
....................................................................................................................


Good morning,
We’re opening Wednesday in a focused holding pattern. After stepping back from record highs yesterday, the Nasdaq is inching up 0.2%, while the S&P and Dow are staying mostly flat. It’s the "calm before the storm" as we prepare for a double-header of market-moving events: a massive tech earnings dump and the end of an era at the Federal Reserve.
The AI story just hit its first real speed bump. Tech stocks took a punch on Tuesday after a report suggested OpenAI missed its internal growth targets. The ripple effect was instant—Oracle dropped 4% and Broadcom and Nvidia both finished in the red. This puts massive pressure on the "Big Four" reporting after the bell today: Alphabet, Amazon, Meta, and Microsoft. Investors are done with the hype; they want to see the actual revenue generated by all those billions spent on AI chips.
Jerome Powell is entering the "Two-Minute Warning." Today marks the conclusion of the Fed’s April policy meeting, and it could be Powell’s last interest-rate announcement before his term ends in May. While nobody expects a rate move today, the market is hanging on every word of his press conference. With Kevin Warsh waiting in the wings and energy prices still sticky, everyone is looking for one final hint at a 2026 "soft landing."
The "War Fog" is finally thinning out. After a chaotic weekend, we’re seeing the first real signs of a diplomatic off-ramp in the Middle East. If the "ceasefire for oil" deal holds, we could see a massive rotation out of energy and back into the growth stocks that have been getting bruised by high fuel costs.
It’s a "pivotal" Wednesday. By the time the closing bell rings, we’ll know if the AI rally has legs or if the "Magnificent Seven" are starting to lose their magic.

🚀 Nvidia Market Cap Hits $5.26T as S&P 500 Scales 7,173
Nvidia reached a historic record of $216.61, propelling its market cap to a staggering $5.26 trillion. The rally lifted the S&P 500 to a fresh all-time high of 7,173.91, even as Nvidia continues to trail its semiconductor peers with a 15% year-to-date gain compared to the Philadelphia SE index's 46% surge.
🛢️ TotalEnergies Boosts Payouts as War Lifts Oil Profits
TotalEnergies SE increased share buybacks and dividends after a Q1 profit rebound fueled by soaring energy prices. The strong trading performance comes as the ongoing Middle East conflict continues to bolster the bottom lines of global energy giants amid unprecedented market volatility.
⚖️ Fed Expected to Stand Pat Amid Iran Conflict Uncertainty
The Federal Reserve is widely expected to hold interest rates steady Wednesday as the Middle East war enters its second month. Officials remain cautious, citing the "uncertainty" of the conflict’s resolution and the potential for sustained high oil prices to eventually ripple through the broader economy.
📦 Amazon Q1 Earnings Spotlight $200B AI Spending Spree
Investors are focused on Amazon’s Q1 results Wednesday, seeking proof that the company’s massive $200 billion capital expenditure plan for 2026 is driving revenue. Amazon accounts for nearly a third of the $650 billion total being spent by AI "hyperscalers" this year.
📉 Robinhood Slumps 10% on Q1 Earnings and Revenue Miss
Shares of Robinhood (HOOD) tumbled in premarket trading after Q1 profits of $346 million fell short of Wall Street's $382 million expectation. The financial app's revenue also missed estimates, reflecting a cooling in crypto trading activity despite the broader market's record-setting pace.
🔍 Alphabet Eyes Gemini Updates with Stock Near Records
Google parent Alphabet reports Q1 results Wednesday, with all eyes on Gemini AI model progress and Cloud revenue growth. Alphabet has outperformed big tech rivals recently, climbing 30% over the last six months as investors position the firm as a primary winner in the AI race.
🌏 Asia Markets Mixed After UAE Exits OPEC Cartel
Asia-Pacific indices diverged Wednesday following news that the UAE will exit OPEC on May 1—a major blow to global oil coordination. Sentiment was further dampened by reports of OpenAI missing revenue targets, though Hong Kong’s Hang Seng managed a 1.2% gain in late trade.

Small Capital Changes How You Trade

You can have a solid strategy… and still struggle because of your account size.
With a small account, every move feels bigger. You’re tempted to increase position size just to see meaningful returns. You take trades you normally wouldn’t. You hold longer, hoping to “make it worth it.”
That’s where risk builds.
Undercapitalization pushes you into bad decisions. Not because your strategy is wrong, but because your expectations don’t match your capital.
Strong traders adjust to their reality. They focus on process, not quick gains. They keep risk small. They build consistency first, then scale over time.
Because growth comes from stability, not pressure.
When your expectations match your capital, your decisions improve. You stop forcing trades. You start protecting what you have.
Some traders like learning how to manage capital and build steadily without unnecessary risk.
If that’s you, you can explore a few market reads here:

Stochastic RSI
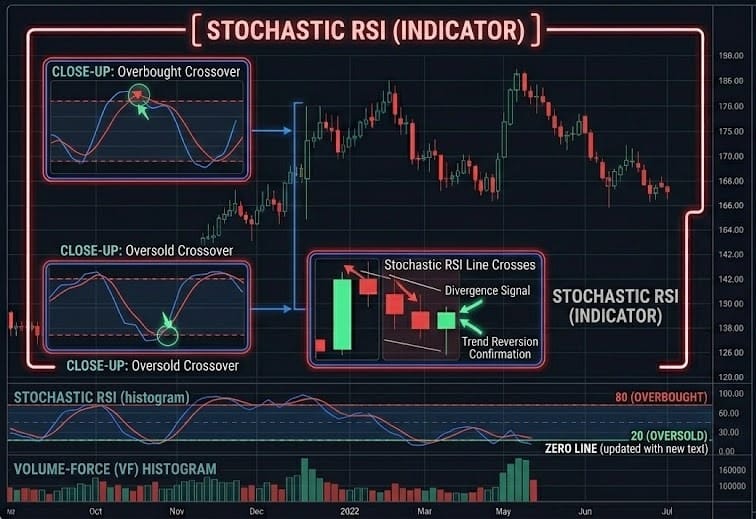
The Stochastic RSI is an "indicator of an indicator." It applies the Stochastic formula to the values of the Relative Strength Index (RSI) rather than to price. This makes it much more sensitive than standard RSI, moving quickly from 0 to 100. It is designed to identify short-term "oversold" or "overbought" momentum shifts that slower indicators might miss.
🛠️ The Strategy Logic
Use these logical triggers to identify the exact moment momentum flips in a fast-moving market:
- IF: The %K (blue) line crosses above the %D (orange) line while both are below 20...
- THEN: A bullish momentum reversal is triggered from an Oversold state. This indicates that the RSI has reached its local bottom and is beginning to accelerate upward.
- THEN: A bullish momentum reversal is triggered from an Oversold state. This indicates that the RSI has reached its local bottom and is beginning to accelerate upward.
- IF: The %K line crosses below the %D line while both are above 80...
- THEN: The market is Overbought. Momentum is rolling over from a peak. This is a primary signal to take profits on longs or look for a short entry.
- THEN: The market is Overbought. Momentum is rolling over from a peak. This is a primary signal to take profits on longs or look for a short entry.
- IF: Both lines move into the "Extreme" zones (above 80 or below 20) and stay flat...
- THEN: The trend is in a High-Velocity state. Do not fight the move! A "pinned" Stochastic RSI at 100 means the price is trending so hard that standard "overbought" rules no longer apply. Wait for the lines to cross back inside the 80/20 range before exiting.
- THEN: The trend is in a High-Velocity state. Do not fight the move! A "pinned" Stochastic RSI at 100 means the price is trending so hard that standard "overbought" rules no longer apply. Wait for the lines to cross back inside the 80/20 range before exiting.
- IF: The %K and %D lines cross the 50 (midpoint) level...
- THEN: The dominant momentum has shifted. Crossing above 50 suggests the bulls have won the "center court" of momentum; crossing below 50 suggests the bears have taken control.
- THEN: The dominant momentum has shifted. Crossing above 50 suggests the bulls have won the "center court" of momentum; crossing below 50 suggests the bears have taken control.
- IF: Price makes a lower low, but the Stochastic RSI makes a higher low (Bullish Divergence)...
- THEN: The downward trend is "hollow." The internal momentum of the RSI is already turning up, suggesting a powerful price bounce is imminent.
💡 Pro Tip
The "Speed Limit" Secret: Because the Stochastic RSI is incredibly fast, it produces many "false" signals in sideways markets. To fix this, increase the Smoothing setting. Most platforms use (3, 3, 14, 14). By changing the smoothing to (5, 5, 14, 14), you filter out the "nervous" jitters of the indicator, resulting in fewer but much more reliable crossovers.
Only trade a crossover if the lines have been in the extreme zone for at least 2–3 candles—never "catch" a cross that happens in the middle of the range (between 30 and 70).

More Lines Doesn’t Mean More Edge
You open your chart.
Lines everywhere. Zones stacked. Indicators layered on top of each other.
It looks serious.
Detailed.
Thought-out.
Feels like you’ve done the work.
Then you see a clean setup on another chart.
Clear level. Simple structure.
And weirdly…
You trust the messy one more.
COMPLEXITY FEELS LIKE EFFORT.EFFORT FEELS LIKE SAFETY.
That’s the bias.
You believe the trade with more analysis behind it must be better.
More confirmation.
More logic.
More “proof.”
But here’s what’s really happening:
You’re not increasing clarity.
You’re hiding uncertainty under more tools.
When charts get busy, decision-making gets foggy.
One indicator says go.
Another says wait.
A third adds “extra confirmation.”
Now you hesitate.
Or worse — you convince yourself a weak setup is strong because it’s backed by enough signals.
CLUTTER CREATES FALSE CONFIDENCE.
It feels like due diligence.
But often, it’s just overcomplication.
Professional traders move the opposite way.
They strip things down.
Fewer levels.
Fewer tools.
Clearer decisions.
Because when a setup is real, it doesn’t need ten layers to justify it.
IT STANDS OUT.
Let’s be honest:
Sometimes you don’t trust the clean setup…
Because there’s nothing to hide behind.
No extra indicator.
No extra confirmation.
Just your decision.
And that feels uncomfortable.
So you add more.
Not to improve the trade.
To feel safer taking it.
But trading isn’t about feeling safe.
It’s about being clear.
So here’s the shift:
If removing tools makes the setup harder to justify…
It probably wasn’t that strong to begin with.
Because the best trades don’t need decoration.
They need clarity — and the confidence to act on it.