
Trump Blesses Intel
....................................................................................................................


Good morning.
Kicking off the week with Intel catching a bid after Trump floated a possible U.S. stake - stock’s holding $28 and retail’s already leaning heavy.
UnitedHealth’s back in play with Buffett dropping $1.6B and Burry buying calls, hedge funds following the flow.
In Korea, traders dumped Big Tech and rotated $259M into ETH-linked names - crypto feels like the momentum trade again.
Bitcoin gave back some heat, sliding from $124K to $117.5K and taking $227M in longs with it.
Tencent beat and got Wall Street back on side, while Goldman’s flagging correction risks with vol at lows and growth slowing.
Busy Monday, plenty on the tape.

🚀 Intel Soars After Trump Mulls Taking a Stake in Chipmaker
A White House lifeline could be Intel’s $28 ticket. Retail traders are already piling in as bullish sentiment hits 96 out of 100.
🏃♀️ Wall Street Titans Pile Into United Health, Stock Surge
Buffett drops $1.6B, Burry loads calls, and hedge funds swarm battered insurer - retail sentiment flips hard to bullish.
🇰🇷 Korean Traders Dump Big Tech for $259M ETH Bet
Alphabet and Tesla are out - Ethereum-linked BitMine is in. South Korea’s retail army is chasing crypto-fueled gains with the same frenzy that once made XRP a moonshot.
🔝 Bitcoin’s Record Run Hits a Wall
From $124K to $117.5K in hours, $227M in longs get wiped. Traders shrug, but macro clouds are building.
✅ Wall Street’s Back on Tencent’s Side
From gaming buzz to AI-fueled ads, Tencent’s beat has 16 brokers betting on new all-time highs, wiping out the scars of China’s tech crackdown.
⚠️ Goldman Sachs Flags Looming Stock Market Correction Risk Volatility has collapsed, the economy is slowing, and Goldman says the odds of a market pullback just jumped.
🔻 Gold Slips as Hot Inflation Cools Fed Cut Hopes
US wholesale prices jump at the fastest pace in three years, pushing yields and the dollar higher and knocking gold toward its first weekly loss in a month.

Airbnb (NASDAQ: ABNB) - TP!
We spotted the bounce early at $121.56 and called the move up.
From there, price respected the zones and marched right into our TP at $126.16.
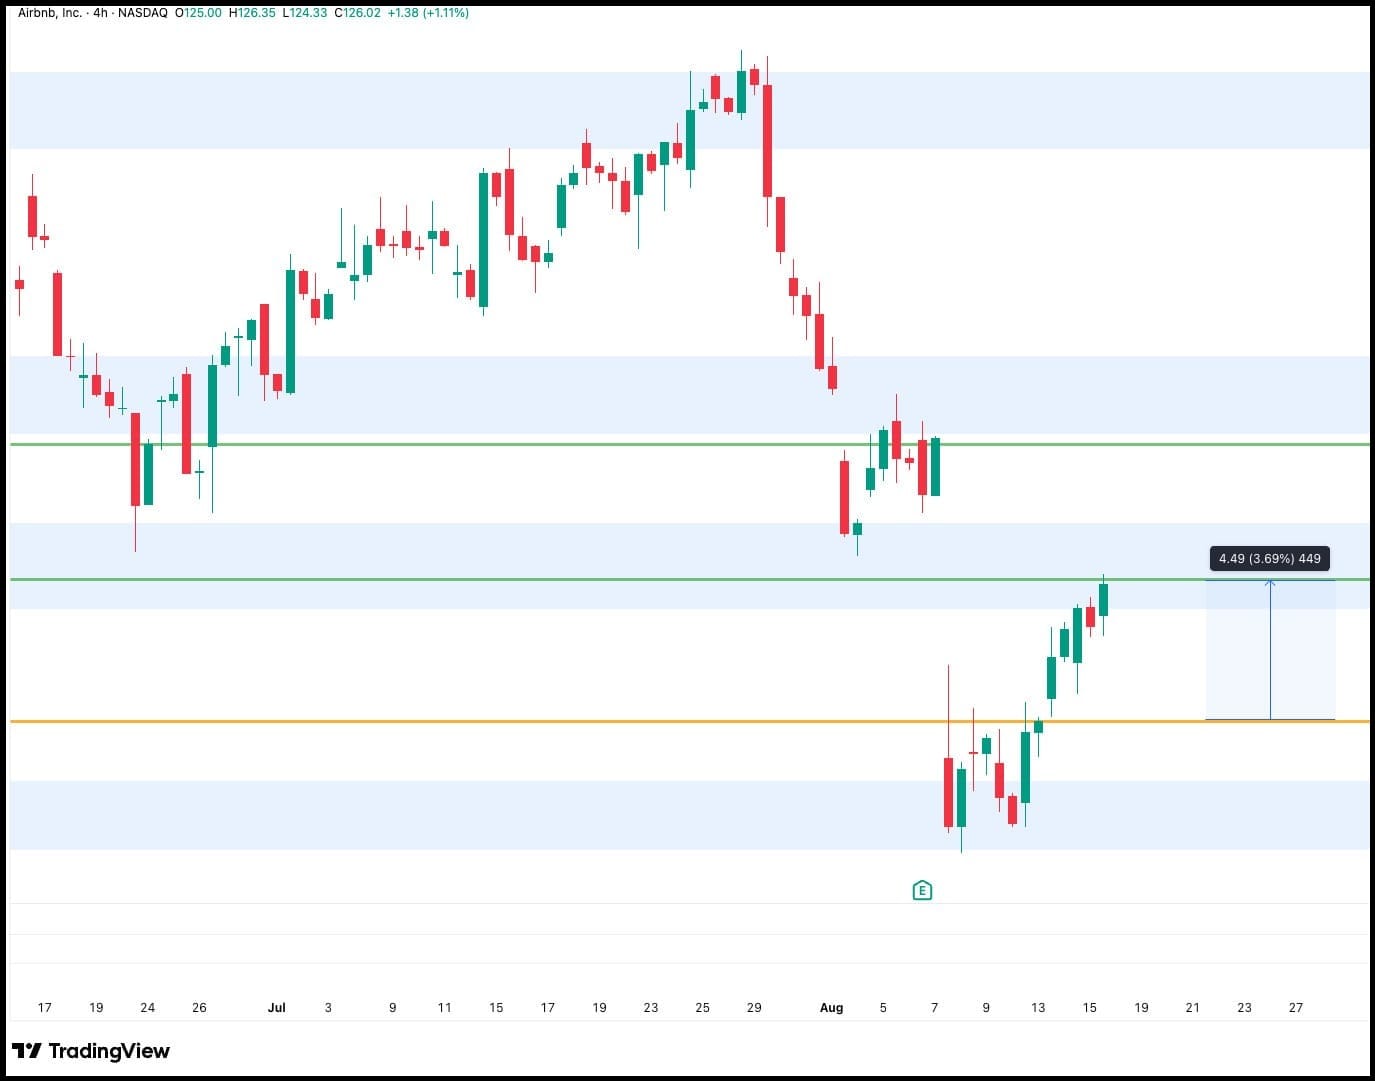
This wasn’t luck.
The chart was showing buyers stacking up strength, reclaiming lost ground after weeks of red candles.
That gap was the magnet.
And price went straight for it.
For those who followed the plan, this trade became a clean, controlled win.
No stress. Just patience rewarded.
Chapter closed.
Recommendation: Arcosa (NYSE: ACA)
ACA gave us the perfect script today.
Price shot up fast, but notice where it stopped.
Right inside our SNR zone.
That’s where the red arrow appeared, and things started to stall.
On top of that, price is stretched out of the band.
Too far from balance, like a rubber band pulled tight.
That’s why we’re stepping in with a sell at $96.69.
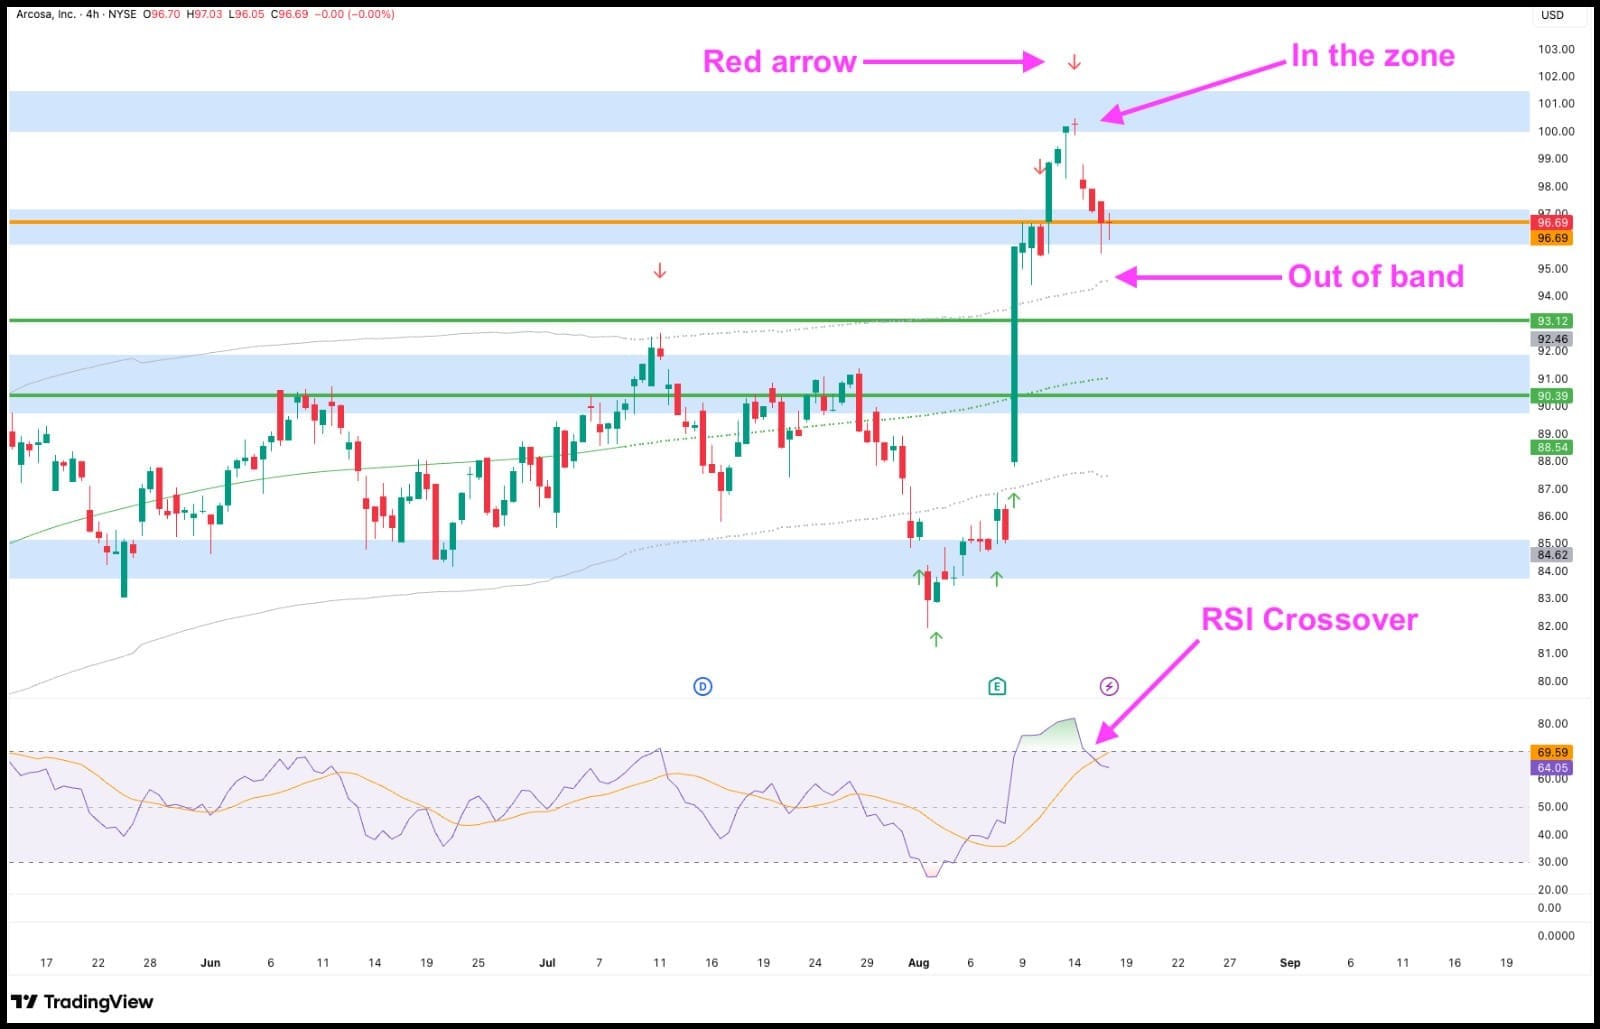
🎯 Targets:
Sell: $96.69
TP1: $93.12
TP2: $90.39
Let's see how this trade goes.

No Degree, No Problem: Why Trading Isn’t College 2.0

Too many people think trading is some elite club where you need a finance degree and Wall Street connections just to get in.
Not true. Trading isn’t college—you don’t need to sit through years of lectures, memorize textbooks, or pay six figures in tuition.
What you do need?
Focus, discipline, and a willingness to learn.
The market doesn’t care where you went to school, or if you even went.
It rewards those who show up, study the charts, stick to their strategy, and manage their emotions when things get tough.
Some of the most successful traders started with zero financial background - they were teachers, engineers, baristas, even delivery drivers.
What they all had in common wasn’t a degree.
It was the drive to learn the rules of the game and practice them until trading became second nature.
So if the thought of “not being qualified” has been holding you back, let it go.
You don’t need Wall Street credentials - you need consistency, patience, and the right system.
👉 Ready to prove to yourself you don’t need a diploma to profit?

Relative Vigor Index (RVI)

The Relative Vigor Index (RVI) is a momentum oscillator that measures the strength of a trend by comparing a security's closing price to its price range.
It is based on the idea that in an uptrend, prices tend to close near their high, while in a downtrend, they tend to close near their low.
The RVI oscillates around a zero line and typically consists of two lines: the RVI line and a signal line.
What to Look For
- RVI Line and Signal Line: The RVI line is the main indicator, while the signal line is a smoothed moving average of the RVI line. Signals are often generated by the crossover of these two lines.
- Zero Line Crossover:
- When the RVI crosses above the zero line, it indicates bullish momentum and that buyers are in control.
- When the RVI crosses below the zero line, it indicates bearish momentum and that sellers are in control.
- Signal Line Crossover:
- Bullish Crossover: A buy signal occurs when the RVI line crosses above its signal line, suggesting a potential shift to the upside.
- Bearish Crossover: A sell signal occurs when the RVI line crosses below its signal line, suggesting a potential shift to the downside.
- Divergence (Key Signal):
- Bullish Divergence: If the price makes a new lower low, but the RVI makes a higher low, it suggests that the selling momentum is weakening. This is a strong hint of a potential bullish reversal.
- Bearish Divergence: If the price makes a new higher high, but the RVI makes a lower high, it suggests that the buying momentum is weakening. This is a strong hint of a potential bearish reversal.
- Trend Confirmation: When the RVI is consistently above the zero line and moving higher, it confirms the strength of an uptrend. Conversely, when it is consistently below the zero line and moving lower, it confirms the strength of a downtrend.

The Mystery of W.D. Gann

Some call him a genius. Others call him a mystic.
William Delbert Gann built his fortune not just on numbers, but on cycles of time, geometry, and even the stars.
Born in 1878 with no formal education, Gann rose from poverty to become one of Wall Street’s most puzzling legends.
His “Gann Angles” and time cycles weren’t simply lines on a chart—they were his way of proving that markets follow hidden laws of nature.
Here’s why he still matters to us today:
- Cycles repeat. Gann believed markets rise and fall in patterns, just like seasons.
- Discipline wins. He warned that hope, fear, and greed destroy more traders than bad analysis.
- Think long-term. He famously forecast market moves decades in advance—and many proved eerily accurate.
So what’s the takeaway for you this Friday?
👉 Gann’s true edge wasn’t his geometry. It was his ability to master himself.
He treated trading like a mirror of the mind - where discipline, not prediction, was the real key.
✨ As you head into the week, ask yourself: are you trading the market… or are you trading your own emotions?


