Tech Selloff Worsens
....................................................................................................................


Good morning,
Friday is opening with pressure already in the system.US stock futures are pointing lower as Amazon’s earnings disappointment hits tech sentiment and traders prepare for another rough session after this week’s selloff.
Futures are leaning red across the board:
- S&P 500 futures down ~0.4%
- Nasdaq 100 futures off ~0.5%
- Dow futures lower by ~0.2%
Tech is once again the weak spot — and Amazon just poured fuel on that fire.
Shares of Amazon dropped about 8% after earnings, as its operating income forecast missed expectations. What spooked investors more was the spending outlook: the company signaled at least $200B in 2026 investment, with AI infrastructure a major focus. Wall Street is getting more sensitive to one question: Are these AI mega-spends translating into near-term growth — or just bigger risk?
That reaction is adding to an already fragile setup:
- Both the S&P 500 and Nasdaq are now negative for 2026
- Software and AI-linked names remain under pressure after this week’s rotation out of high-flying tech
- Traders are still digesting the broader “AI disruption” narrative hitting legacy tech models
The risk-off mood is spreading beyond equities:
- Bitcoin continues its slide, trading at levels not seen since 2024
- Silver is falling again after its retail-driven surge faded
There are a few pockets of strength though:
- Reddit jumped after an earnings beat, upbeat guidance, and a buyback announcement
- Roblox rallied on strong results
- MicroStrategy rebounded premarket after management eased debt-risk fears despite a bitcoin-driven quarterly loss
One more shift for traders’ calendars: The January jobs report, originally due today, has been pushed to next Wednesday — but this week’s weak job openings data and rising layoff announcements are already raising eyebrows.
Today’s tone: tech shaken, AI spending questioned, and sentiment still fragile going into the open.

📉 U.S. Futures Slide as Tech Selloff and Weak Jobs Data Hit Sentiment
Dow, S&P 500 and Nasdaq futures fell sharply as selling in technology shares and softer labor data weighed on markets ahead of key Fed commentary and economic reports.
🛒 Amazon Shares Sink 10% After Earnings Miss and $200B Spending Forecast
Amazon stock tumbled in after-hours trading after mixed Q4 results and a massive $200 billion 2026 investment plan reignited concerns over margins and cash flow.
🪙 Bitcoin, Ethereum Slammed in $2.6B Crypto Liquidation Bloodbath
Bitcoin plunged toward $65,000 as a wave of forced selling triggered $2.6 billion in liquidations, marking one of the largest crypto wipeouts on record.
🌏 Asian Markets Sink as Global Tech Rout Spreads Worldwide
Asian equities slid as the tech selloff intensified, with Indonesia’s market dropping 2% after a Moody’s downgrade and global software stocks shedding over $1 trillion in value.
🚗 Stellantis Shares Crash 20% on $26B EV Overhaul Charge
Stellantis stock plunged after the automaker warned of a €22 billion ($26 billion) hit from restructuring its business to accelerate electric and hybrid vehicle production.
💵 Dollar Heads for Strongest Week Since November as Yen Steadies
The U.S. dollar climbed toward its best weekly performance since November, while the euro hovered near $1.18 and the yen stabilized ahead of key elections.
🛢️ Oil Extends Decline as U.S.–Iran Talks Ease Supply Fears
Oil prices fell for a second straight session, with Brent sliding to $67.05 a barrel, as investors looked ahead to U.S.–Iran nuclear talks that could ease supply risks.

Too Much Knowledge, Zero Execution
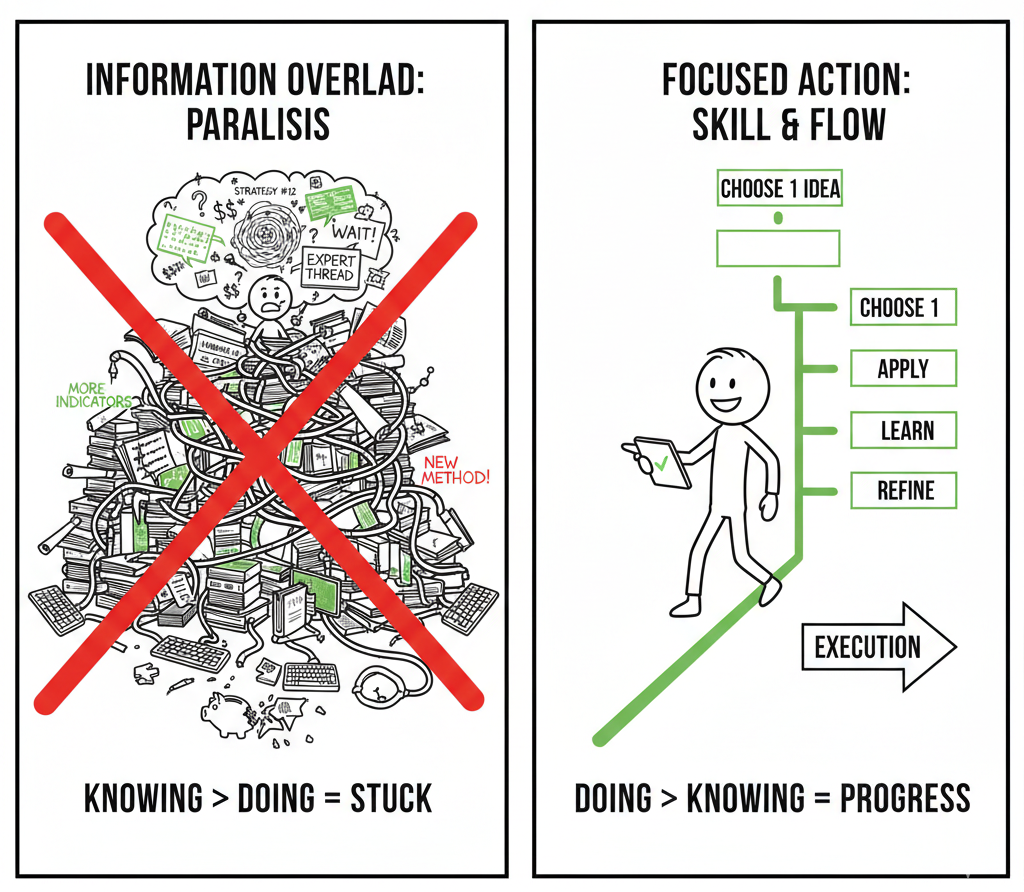
At some point, learning stops helping and starts hiding you. You watch another video. Read another thread. Save another strategy. It feels productive, but nothing changes.
Trading skill doesn’t come from knowing everything. It comes from applying one idea long enough to see what works. When your head is full, decisions get slower. Doubt increases. Execution disappears.
Progress shows up when you simplify. Fewer inputs. One framework. Clear rules. Action turns information into experience. That’s where confidence is built.
If you want trading content that cuts through the noise and gives you clear direction instead of overload, these newsletters help. They focus on what to pay attention to—and what to ignore—so you can execute with confidence.

Hanging Man
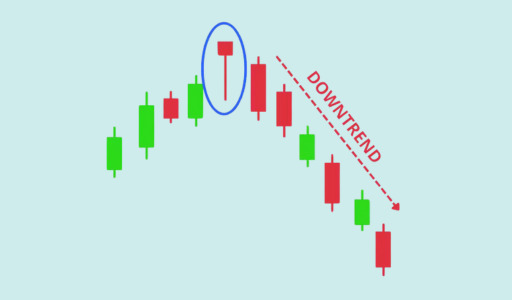
The Hanging Man is a bearish reversal pattern that looks identical to a Hammer but appears at the top of an uptrend.
Despite its bullish appearance (a long lower wick), it actually signals that sellers are starting to find their footing and that the previous "invincible" uptrend is beginning to crack.
It represents a "warning shot" that the bulls were unable to keep the bears away for the entire session.
🛠️ The Strategy Logic
Use these logical triggers to identify when a market top is being formed:
- IF: The lower wick is at least two times the length of the candle body and appears at the peak of a rally...
- THEN: The pattern is valid. This shows that a massive sell-off occurred during the day, and even though the price recovered, the "floor" has been tested and found to be weak.
- THEN: The pattern is valid. This shows that a massive sell-off occurred during the day, and even though the price recovered, the "floor" has been tested and found to be weak.
- IF: The Hanging Man forms after a long, steady uptrend or near the Upper Keltner Channel...
- THEN: The probability of a reversal is high. The market is overextended, and the appearance of this "heavy" candle suggests that the buying pressure is no longer unanimous.
- THEN: The probability of a reversal is high. The market is overextended, and the appearance of this "heavy" candle suggests that the buying pressure is no longer unanimous.
- IF: The candle following the Hanging Man closes below the Hanging Man’s body...
- THEN: The bearish reversal is confirmed. This is the critical "trigger" for a trade. Without this confirmation, the Hanging Man is often just a "pause" before the trend continues higher.
- THEN: The bearish reversal is confirmed. This is the critical "trigger" for a trade. Without this confirmation, the Hanging Man is often just a "pause" before the trend continues higher.
- IF: The volume on the Hanging Man day or the confirmation day is unusually high...
- THEN: The signal is high-conviction. High volume during a Hanging Man suggests that "smart money" was the one doing the selling, while retail traders were the ones trying to buy the intraday dip.
- THEN: The signal is high-conviction. High volume during a Hanging Man suggests that "smart money" was the one doing the selling, while retail traders were the ones trying to buy the intraday dip.
- IF: The "body" of the Hanging Man is red (bearish)...
- THEN: The signal is slightly more potent than a green one. A red body means the price actually closed lower than it opened, proving the bears won the daily tug-of-war despite the recovery from the lows.
💡 Pro Tip
The "Visual Trap": The Hanging Man is one of the most dangerous patterns for beginners because it looks like a bullish Hammer. The secret to telling them apart is Location, Location, Location.
A Hammer "hammers out" a bottom after a fall; a Hanging Man "hangs" the bulls at the top of a peak. If you see this pattern, do not buy the "bounce"—wait for the next candle to break the low, as that is when the trap snaps shut on the buyers.

The Revenge Resize
You take a loss. It stings more than it should.
Not because of the money, but because of the meaning you attach to it.
You replay the setup.
You zoom in on the candle. You convince yourself the market did something wrong.
Then the next trade shows up.
You increase size slightly. You tell yourself you feel clearer now. More focused.
Truth is, you want emotional repair, not good execution.
That resize rarely comes from your plan. It comes from irritation.
This is where accounts start leaking.
Build a rule that triggers after every full loss:
Next trade goes down in size. Not up. Down.
You wait for one clean setup only.
You write the reason for entry before you click buy or sell.
Losses test your structure more than your strategy. If your sizing changes with your mood, risk controls you.
Keep size tied to rules, not feelings.
That single habit protects your equity curve more than any entry model.