
Musk Tesla Magic
....................................................................................................................


We’re barely 100 days into Trump 2.0, and the market’s already sweating bullets.
The S&P 500 is down nearly 8% — the worst start since Nixon.
History says that’s bad news… but the bulls are still hoping for a bounce.
Meanwhile, Tesla just pulled a magic trick — earnings miss?
No problem. A surprise detail buried in the 10-Q + Musk hype + tariff relief = TSLA up 23%.
The comeback crew is officially in rally mode. 🐂
Asia’s green, Wall Street’s twitchy, and traders are hunting for signals in the fog.
The crucial updates?
You know we’ve got 'em. ⚡
Let’s get to it.

🇺🇸 Trump’s Rocky First 100 Days Rattles Stocks. Will History Repeat Itself?
The S&P 500 is down nearly 8% under Trump’s early second term, the worst since Nixon. Historically, rough starts mean lower gains ahead—but could market pressure force a turnaround?
🚗 Tesla Stock Rips Higher Despite Earnings Miss
A hidden gem in Tesla’s 10-Q, Musk’s Tesla comeback, and tariff relief have ignited a 23% rally. With full self-driving and cheaper cars on the horizon, can TSLA erase its 2025 losses? Bulls are betting big.
❄️ Global Markets Freeze Amid US-China Standoff
A Storm Is Brewing as tariffs pile up and diplomacy stalls, currencies, stocks, and commodities are all flashing warning signs. This could just be the opening act.
💥 Bitcoin ETF Demand Explodes as Prices Break Out
Institutional investors are flooding back into Bitcoin, driving record inflows and flipping market sentiment nearly overnight. The momentum looks unstoppable.
📈 Gold’s Surge Stalls as Silver Gears Up for a Monster Move
With gold flashing warning signs and silver coiling for a major breakout, traders might want to rethink their strategies before the next big move.
🐉 Asian Stocks Rise While Tariff Talk Heats Up
U.S. markets stayed quiet, but global investors aren’t buying the peace. With Trump’s tariff hammer hovering, is a market shakeup around the corner?
🛢️Crude Falls as Recession Risks Grow. Tariffs Are Doing the Damage
Oil is under pressure as the U.S.-China trade standoff pushes global demand projections lower. Economists are warning of a downturn, OPEC+ might flood the market, and analysts are cutting price targets across the board.

Updates: Copart Inc. (NASDAQ: CPRT)
Trade Closed at TP1
We entered a sell at $60.88, anticipating a clean pullback and Copart delivered.
Just a day later, TP1 was hit at $59.25, locking in a 2.68% gain before leverage.
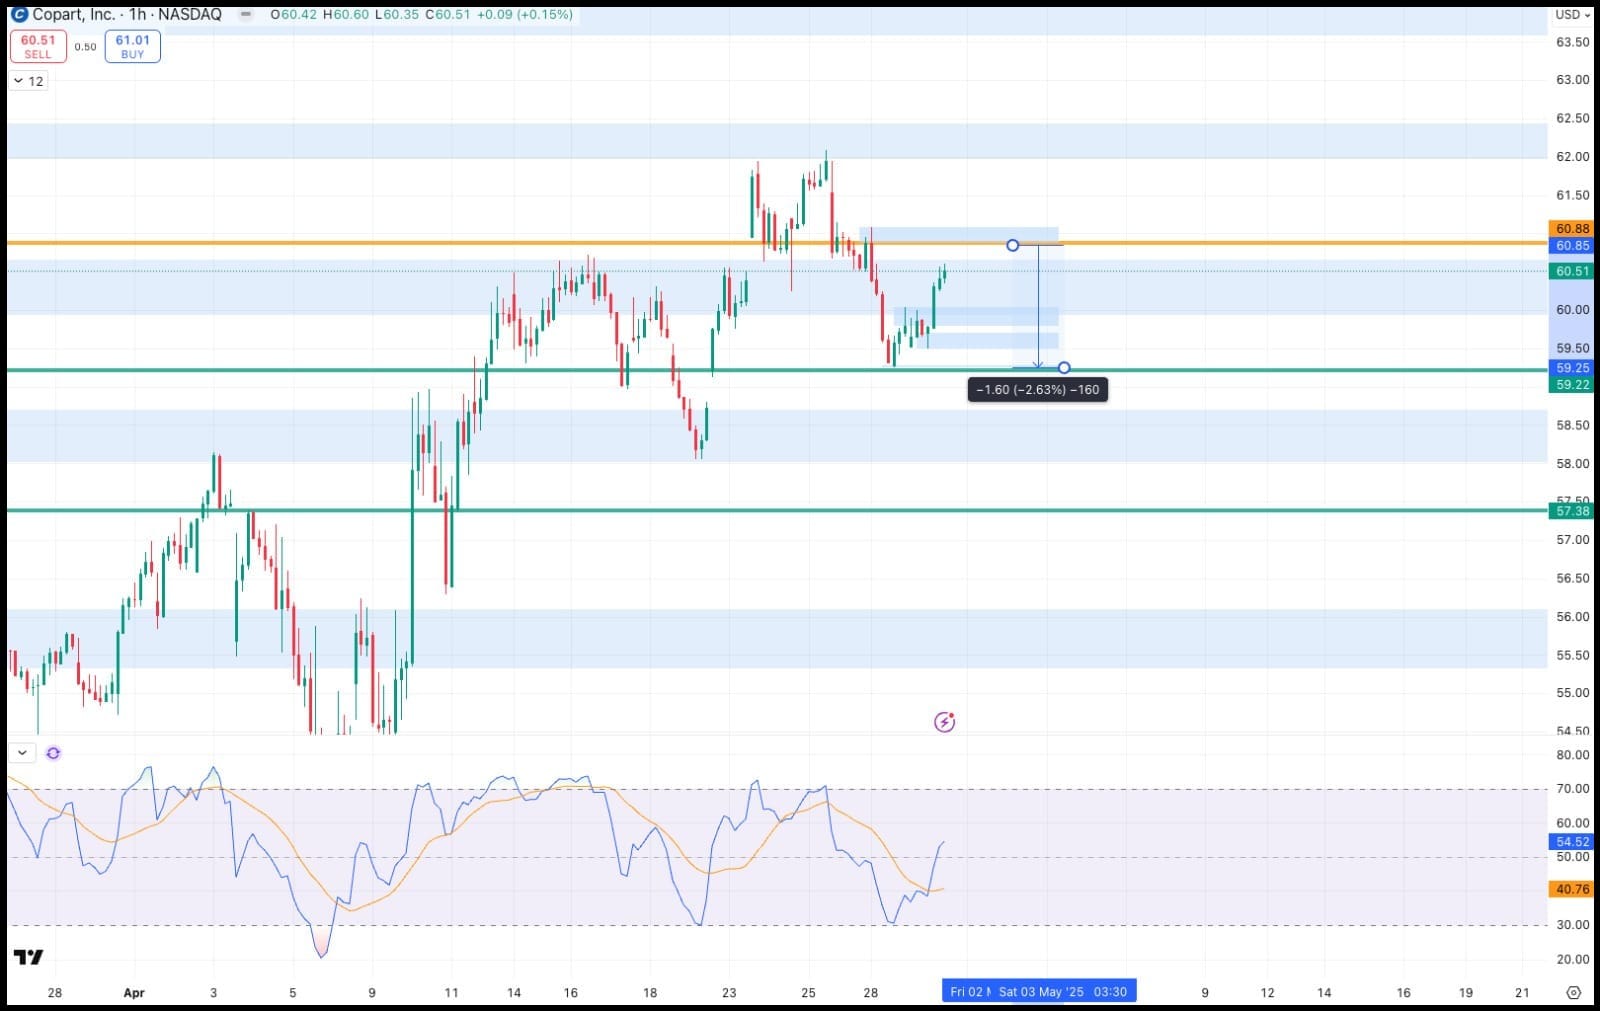
The setup played out exactly as planned, so I decided to close the full position at TP1 and book the profit.
Quick. Precise. No need to overstay.

Trading in Your Head But Too Shy to Click? Time to Ghost the Fear.

Fear of looking silly or messing up in front of others keeps a lot of smart people from ever placing a single trade.
But here's the truth - every expert trader once looked clueless, and no one gets good without first being bad.
These curated trading newsletters act like private mentors in your inbox, helping you learn the ropes without the spotlight, so you can build quiet confidence before ever going live.
They strip away the overwhelm, break down what actually matters, and help you grow without fear of judgment.
👉 If you’re tired of guessing your way through trading, these newsletters will give you the guidance you need to move forward with confidence:
Subscribe to these newsletters now

Descending Triangle

A Descending Triangle is a bearish continuation chart pattern that forms during a downtrend, signaling that the price is likely to continue moving downwards after a period of consolidation.
It's characterized by a flat lower trend line (support) and a declining upper trend line (resistance).
What to Look For:
- Flat Lower Trend Line (Support): This line connects a series of roughly equal lows.
- Declining Upper Trend Line (Resistance): This line connects a series of successively lower highs.
- Converging Trend Lines: The upper and lower trend lines converge, forming a triangle shape.
- Decreasing Volume: Trading volume typically decreases as the pattern forms, indicating a period of consolidation.
- Breakdown Below Lower Trend Line: The pattern is confirmed when the price breaks decisively below the flat lower trend line (support) with a significant increase in volume.
- Bearish Continuation: The breakdown suggests that the prior downtrend is likely to resume.
- Measured Move: The potential price target after the breakdown can be estimated by measuring the height of the back of the triangle (the widest part) and projecting that distance downwards from the breakout point.

You ever look at a chart and think: "Okay… this setup checks out. Everything’s there. But something just feels... off"?

That’s not hesitation.
That's the experience whispering, “We’ve never danced to this rhythm before.”
See, not every picture-perfect setup deserves your money.
Trading isn't about ticking boxes.
It’s about knowing your system like it’s second nature - knowing how it moves, how it breathes, and when it's just pretending to be what it's not.
Here’s the truth:
🎯 Smart traders don’t trade every ‘valid’ setup - they trade what they’ve earned the right to trust.
The ones they’ve seen unfold a dozen times.
The ones they’ve screen-shotted, tracked, studied, and felt in their gut.
So when a chart looks good but feels weird - pause. Screenshot it. Walk away.
Let it prove itself again and again.
Then make it part of your arsenal.
Because you don’t go to battle with weapons you’ve never fired.
And you sure as hell don’t put your capital on setups that haven’t earned their stripes.
👉 Be picky. 👉 Be patient.
👉 Because only the familiar pays.


