Google’s $400B Threat
....................................................................................................................


Good morning — and buckle up.
Markets are moving, warnings are flying, and Google just stepped into the courtroom crosshairs.
Yep, Barclays says the search giant could lose up to $400 billion if Chrome’s power gets clipped.
That’s nearly a third of Google’s search cash - and a judge could pull the trigger.
But that’s just the start.
The crucial updates below break down every angle - from global trade shocks to Big Tech flexes.
Traders are watching every tick, every headline, and every legal ruling like it’s a live landmine.
Let’s break down what you really need to know this morning 👇

🏛️ OECD Warns, Markets Stall
The Dow dipped and the S&P hovered as fresh warnings hit from the OECD over Trump’s trade tactics. Now all eyes are on upcoming negotiations — and a potential Xi-Trump call.
🌐 GOOGL Faces $400B Risk
Chrome accounts for a third of Google’s search cash — and now it could be ripped away. A judge’s ruling could trigger a 25% nosedive, Barclays warns.
🐂 Dow Hits Bull Market!
Despite fresh Trump tariffs, the Dow rallied into bull market territory — up 20% from its lows. But Tuesday’s dip and JPMorgan’s warning suggest the good times may not last.
7️⃣ Magnificent 7 Dominate Again
Big Tech powered 62% of the S&P 500's May rally — its best May in 30+ years. With earnings up nearly 28%, investors are piling back into growth.
🚁 Stocks Drift, Tariff Fog Lingers
Wall Street hovered while the world watched for signs of economic fallout from U.S. trade moves. Growth forecasts are slipping.
🚀 Applied Digital Skyrockets 40%
A $7B AI deal with CoreWeave just sent APLD shares vertical. The 15-year lease powers a 250MW boost to Ellendale’s data empire.
🪙 Gold Retreats From Peak
The dollar’s slight uptick knocked gold off its recent rally. Still, looming U.S.-China talks and tariff threats keep the mood cautious.

No New Winners Today — But the Game’s Not Over
No fresh wins to report today.
But that doesn’t mean we’re done - just means we’re holding our ground.
🟠 Still in Play:
DexCom Inc. (NASDAQ: DXCM) - Still holding the position
Murphy USA Inc. (NYSE: MUSA) - Still holding the position
However, I’m watching for one thing:
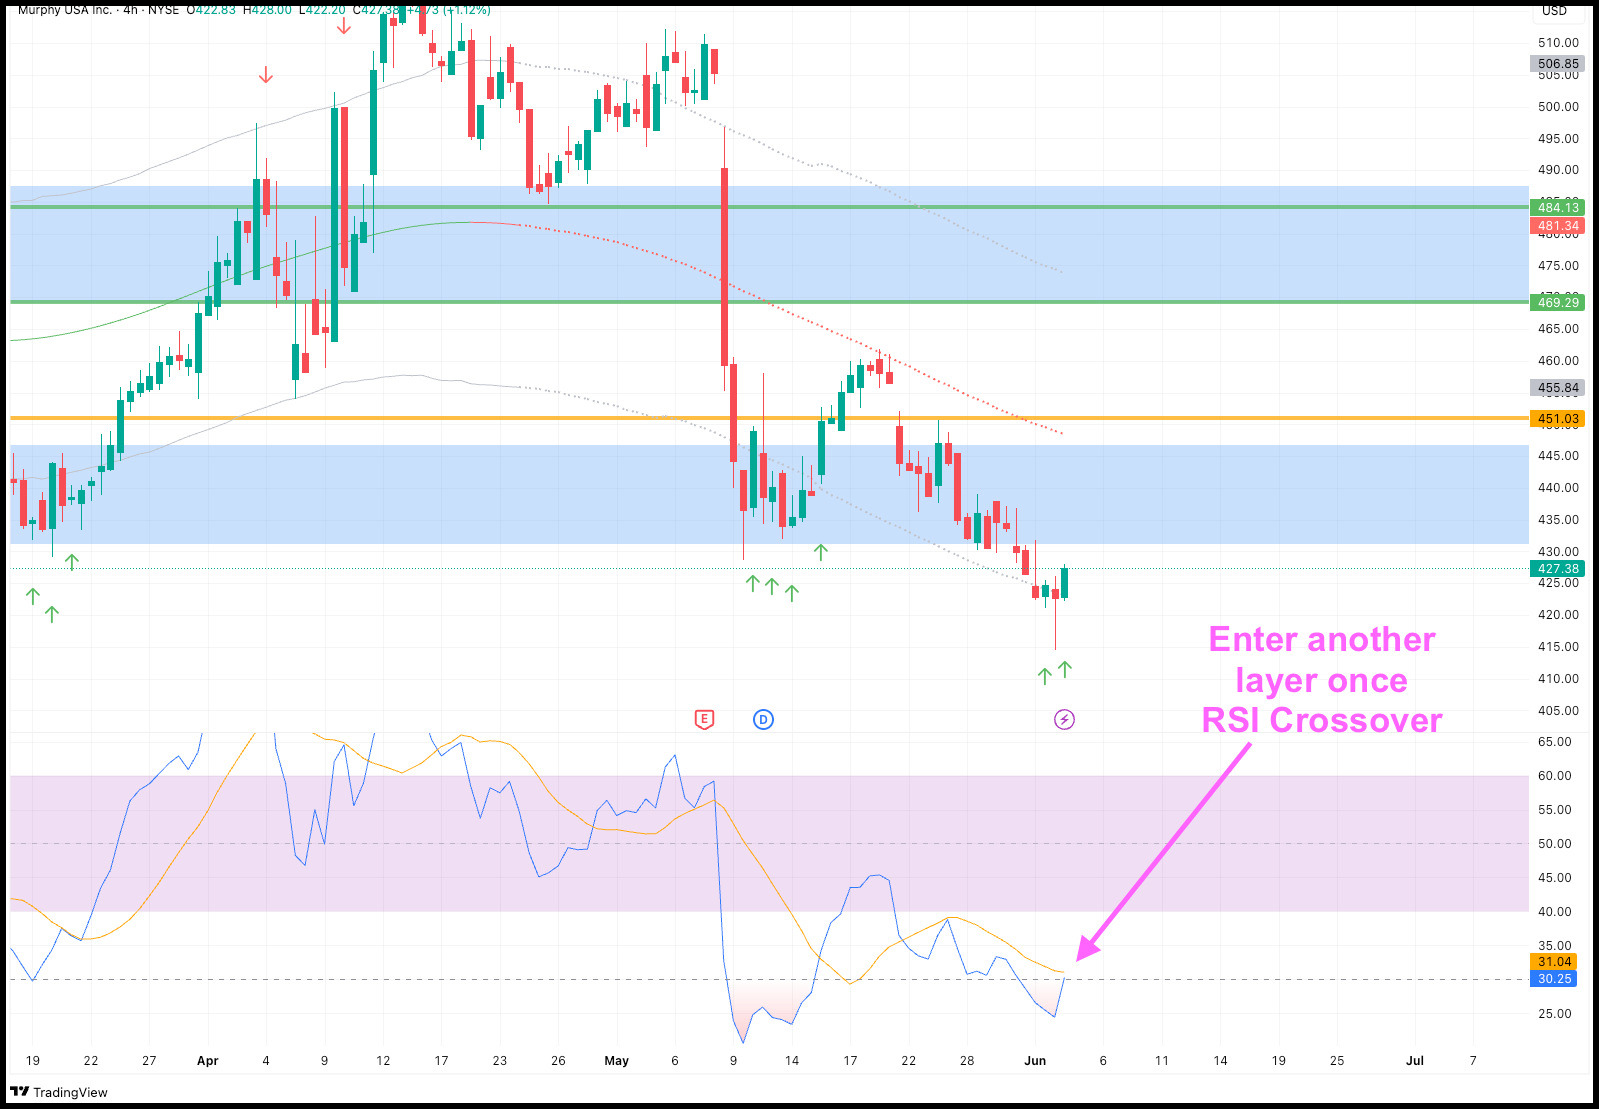
📈 RSI crossover.
Once that confirms, I’ll be layering in again to ride the next leg up.
Update you soon!

Your Savings Don’t Have to Die for You to Learn to Trade
Too many new traders sit on the sidelines, paralyzed by the fear of losing everything.
But here’s the truth: smart trading doesn’t mean risking your life savings - it means learning how to manage risk, start small, and scale with confidence.
The right newsletters break down complicated strategies into practical, bite-sized lessons.
They’ll show you how to protect your capital, avoid rookie mistakes, and build your skills without blowing up your account.
You don’t need to go “all in” to get started - you just need better guidance.
If you’re tired of trading in fear, these newsletters will teach you how to take smart, low-risk steps toward real progress
👉 Get them now while you still can.

Money Flow Index (MFI)
The Money Flow Index (MFI) is a momentum oscillator that measures the strength of money flowing into or out of a security.
It's often called a "volume-weighted RSI" because it incorporates volume into its calculation, unlike the standard Relative Strength Index (RSI) which only uses price.
What to Look For:
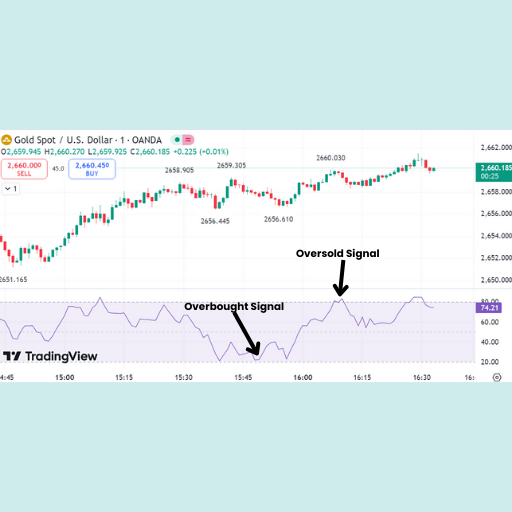
- Overbought/Oversold Levels:
- MFI readings above 80 are generally considered overbought, suggesting that buying pressure is excessive and a price pullback or reversal might be imminent.
- MFI readings below 20 are generally considered oversold, suggesting that selling pressure is exhausted and a price bounce or reversal might be imminent.
- These levels are guidelines and can be adjusted based on the specific asset and market conditions.
- Divergence:
- Bullish Divergence: If the price makes lower lows, but the MFI makes higher lows, it can indicate weakening selling pressure and potential buying interest, signaling a possible bullish reversal.
- Bearish Divergence: If the price makes higher highs, but the MFI makes lower highs, it can indicate weakening buying pressure and potential selling interest, signaling a possible bearish reversal.
- Failure Swings: Similar to RSI, MFI can form "failure swings" (when MFI fails to reach a previous high in an uptrend or a previous low in a downtrend before reversing), which can provide strong reversal signals.
- Trend Confirmation:
- A rising MFI generally confirms an uptrend, as it indicates money is flowing into the asset.
- A falling MFI generally confirms a downtrend, as it indicates money is flowing out of the asset.
- Volume Significance: Because MFI incorporates volume, its signals are often considered more robust than price-only oscillators, as they reflect the underlying buying and selling activity.

The Clock’s Ticking — But So Are You
June’s here - not just another month, but the final stretch of the first half of the year.If the scoreboard isn’t showing what you hoped for, that’s not a reason to tap out.
Truth is, some of the biggest shifts happen in silence.
The charts may be slow. Your growth may feel invisible. But the grind is still doing its work - if you stay in it.
This isn’t the moment to chase shortcuts.
It’s the moment to go deeper, not faster.
- Refocus.
- Recommit.
- Refine your edge.
Six months left on the clock. That’s more than enough time — but only if you use it with intention.
Show up smarter.
Train harder.
Cut the noise.
The second half is wide open… but only for the ones still standing.

It’s time - Let’s go!