
Fed Signals Cut
....................................................................................................................


Good morning!
It’s the start of a holiday-shortened week, and markets are trying to shake off the November blues.
After getting battered for most of the month, futures are finally showing a little life: the Dow is up, the S&P is up, and the Nasdaq is leading the charge with a 0.7% pop.
Why the optimism?
A single line from New York Fed President John Williams - hinting that a December rate cut could still be on the table was all it took to spark a little pre-Thanksgiving cheer.
But let’s not pretend the damage isn’t there: AI stocks have been pummeled, the Nasdaq is still down over 6% this month, and the S&P is bleeding too.
With the shutdown finally over, economic data is trickling back, and Tuesday’s PPI and retail sales reports will set the tone. Earnings slow to a whisper this week - think Alibaba, Dell, and a few retailers - before markets take a breather for the holiday.
A shaky rebound, a hopeful Fed, and a market trying to decide whether to heal… or wobble again.

📶 Nasdaq, Dow Futures Climb After Woeful Week
U.S. stock futures ticked higher early Monday, following a rough week for equities. Oversold conditions and expectations of a rally in durable-growth names are sparking fresh optimism.
🔌Meta Enters Power Markets to Fuel AI
Meta Platforms is gearing up to trade electricity wholesale — a strategic move aimed at securing long-term power for its massive AI data centres and speeding new plant construction.
✂️ Stocks Rise on High Odds of Fed Cut
Markets are powering ahead as traders push the probability of a Federal Reserve rate cut in December to ~60–70%, lifting equities despite mixed signals on the U.S. economy.
📈 Tech Rally Buoys Asia as U.S. Markets Calm
After a volatile week, Asian equities rebounded on the back of U.S. tech strength and calmer sentiment. Investors are cautiously optimistic heading into a light data week.
⬆️ Bitcoin Climb Supported by Eased Selling Pressure
Analysts say Bitcoin’s recent dip may be easing out as selling pressure falls—potentially setting the stage for a rebound if risk appetite returns.
📊 Meme Stocks Under Pressure as Retail Pulls Back
The buzz around retail-favourite “meme stocks” is fading: major names like Beyond Meat, Opendoor Technologies and SoundHound AI have dropped 8-20% recently as Wall Street exercises caution.
🔄 Gold Holds Steady Amid Market Jitters
Gold remained stable near US $4,050/oz as markets weigh the odds of a Fed rate cut, with investors treating bullion as a watch-point rather than a full safe-haven sprint.

The Cure for “I Don’t Even Know Where to Start”
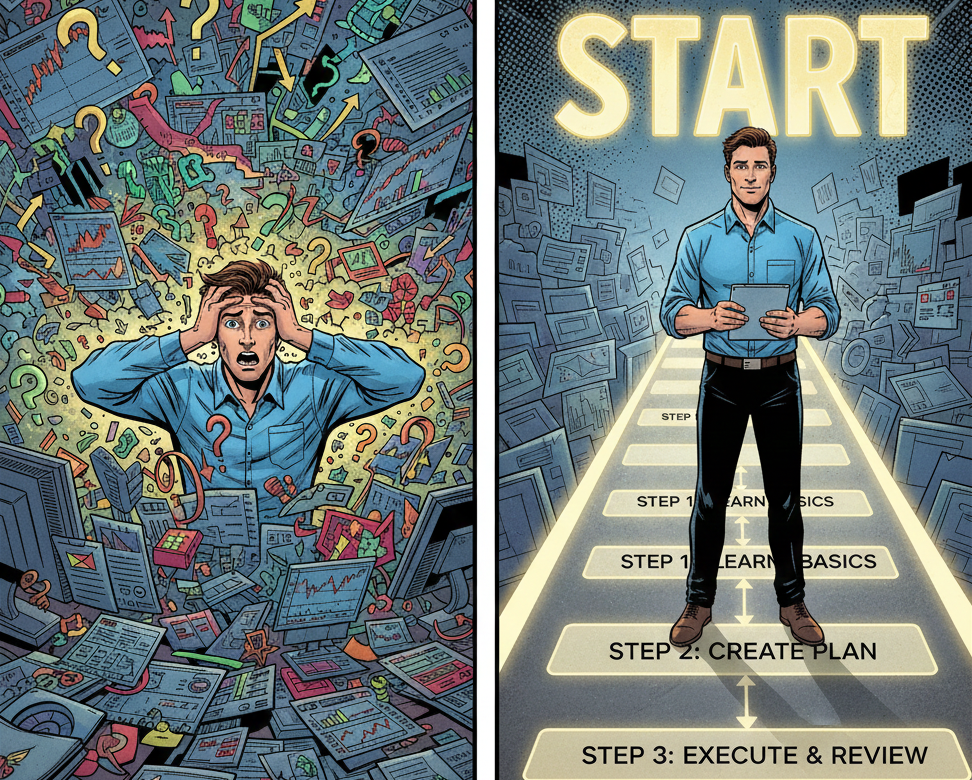
Most new traders freeze because they face too many choices. Every chart looks important. Every ticker feels urgent.
The mind shuts down when the process is unclear. That hesitation turns into avoidance.
You tell yourself you will start later, but later never arrives.
You do not need more motivation. You need fewer decisions.
A simple routine removes the mental load. One checklist, one setup, one time window.
When the steps are clear, your mind relaxes. You focus on execution instead of juggling options.
Trading becomes easier when you give yourself structure.
The confusion fades. The hesitation drops.
You finally start.
If you want routines that cut through overload and help you trade with a clear head, these newsletters help. They walk you through simple steps you can follow without pressure.

Triple Bottom
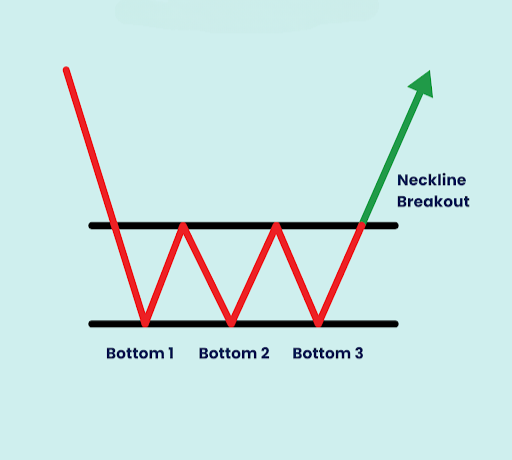
The Triple Bottom is a powerful bullish reversal chart pattern that occurs after a clear downtrend. It signals that the sustained selling pressure has been completely exhausted and that a major reversal to the upside is imminent.
The pattern is formed when the price attempts to break a strong support level three consecutive times but fails each time, demonstrating that buyers (demand) are consistently entering the market at that fixed low price. It is the mirror image of the Triple Top pattern.
What to Look For (Key Features and Signals)
- Prior Downtrend: The pattern must follow a clear, established downtrend for it to be a valid reversal signal.
- Three Troughs (Bottoms): The pattern features three distinct price troughs that reach approximately the same low price level. These three failures establish the strong, horizontal support line.
- Two Peaks (Valleys): There are two intermediate highs (rallies) between the three bottoms. Connecting the highest points of these rallies forms the neckline, which serves as the critical resistance level.
- Volume Trend: Typically, trading volume tends to decrease with each successive low, signaling a weakening of selling interest and conviction. However, volume should increase significantly on the final rally and the subsequent breakout, confirming strong buying pressure.
- Bullish Confirmation (Breakout): The Triple Bottom pattern is only confirmed when the price decisively breaks and closes above the neckline resistance level after the third bottom. This breakout is the key entry signal for a long position and should be accompanied by a surge in buying volume.
- Target Price: The traditional price target is calculated using the measured move technique. You measure the height of the pattern (the distance from the lowest trough up to the neckline) and project that distance upward from the neckline breakout point.

Undertrading as a Power Move
Most traders think activity equals progress.
They believe more trades mean more opportunity.
More charts. More setups. More action.
That thinking drains accounts faster than any drawdown.
The skill that separates real traders from gamblers is simple.
Knowing when not to move.
Undertrading looks weak from the outside.
People assume you are missing out. They assume you are scared. They assume you are slow.
The truth is the opposite.
Undertrading is a sign of control.
It shows you understand your edge.
It shows you value your capital. It shows you refuse to trade out of boredom, noise, or pressure.
Sitting on your hands takes strength.
It is easier to click than to wait. Waiting forces you to confront your emotions.
Impulse. FOMO. Restlessness. Ego.
When you can sit through all of that without forcing a trade, you hold the real power in the market.
Your account does not grow from busy trading. It grows from disciplined trading.
One clean setup. One prepared entry. One good move. One high-quality decision.

Undertrading is not inactivity.
It is intention.
It is you choosing precision over chaos.


