
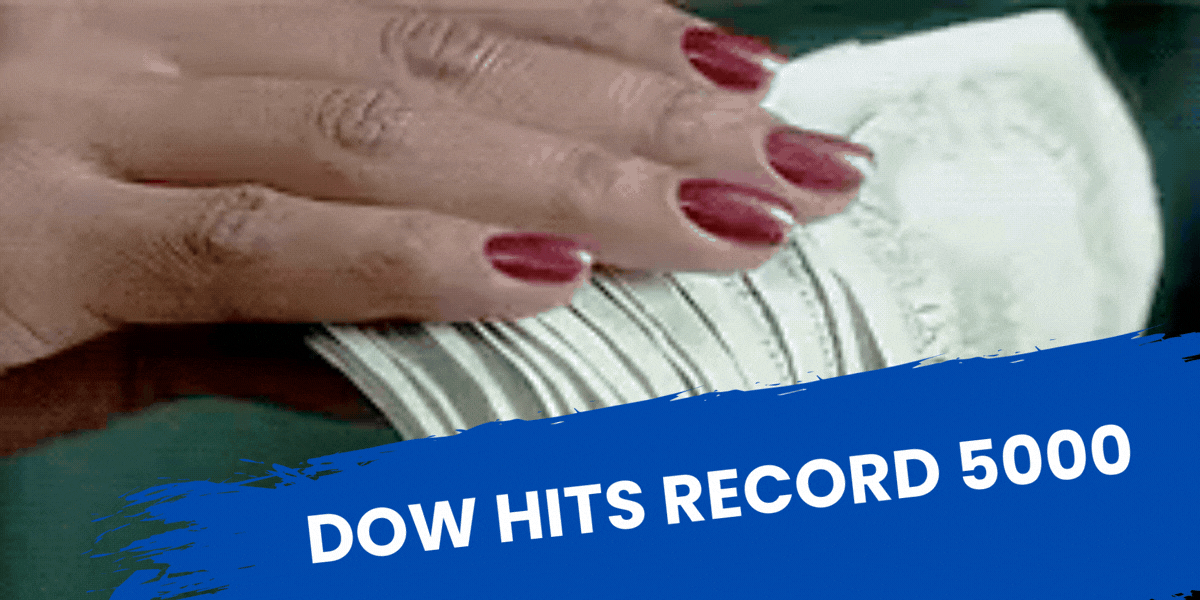
Dow Hits Record 50,000
....................................................................................................................


Good morning traders,
US stock futures opened the week on uneven footing as markets weighed last week’s volatility against the Dow’s historic close above 50,000.
Futures on the Dow, S&P 500, and Nasdaq moved between slight gains and losses, suggesting momentum is being tested rather than extended. Bond prices edged lower after reports that Chinese regulators encouraged banks to reduce US debt exposure, adding a cautious macro tone to the open.
Friday’s move was decisive — the Dow surged more than 1,200 points, with the S&P 500 and Nasdaq up roughly 2%, recovering from a tech-led pullback.
Much of the earlier pressure centered on software stocks and concerns around aggressive AI spending, with major tech firms planning about $650 billion in combined investment.
Focus now turns to delayed jobs and inflation data, alongside earnings from Coca-Cola, McDonald’s, Cisco, and ON Semiconductor — all key for rate expectations.

📈 Stock Futures Tick Higher as Wall Street Awaits Jobs and Inflation Data
U.S. futures edged up with S&P 500 +0.2%, Nasdaq 100 +0.3%, and Dow +87 points, after the Dow surged 1,200 points (2.5%) Friday to close above 50,000 for the first time.
🧠 Samsung Shares Jump 6.4% on HBM4 Chip Production for Nvidia
Samsung stock rallied as much as 6.4% after reports it will begin mass production of HBM4 memory chips, with shipments to Nvidia expected as early as next week for next-gen AI accelerators.
🇯🇵 Japan’s Nikkei Hits Record High After Takaichi’s Landslide Election Win
Japanese stocks surged to new highs after Prime Minister Sanae Takaichi secured a two-thirds supermajority, while the yen strengthened to 156.88 per dollar on expectations of fiscal stimulus.
🥇 Gold Reclaims $5,000 as Dollar Softens Ahead of U.S. Jobs Data
Spot gold rose 1.3% to $5,026/oz and silver jumped over 4%, extending last week’s rally as the dollar hit its weakest level since Feb. 4 and investors positioned for key labor data.
🪙 Bitcoin Holds Above $70,000 While Gold Stays Firm Over $5,000
Bitcoin stabilized above $70,000 after recent volatility, while gold remained elevated above $5,000 an ounce, underscoring sustained demand for alternative and safe-haven assets.
💊 Novo Nordisk Shares Jump 8% After Hims Scraps $49 Weight-Loss Pill
Novo Nordisk stock climbed more than 8% after Hims & Hers abandoned plans for a $49 weight-loss pill following legal pressure from Novo and the FDA.
🛢️ Oil Drops Over 1% as U.S.–Iran Talks Ease Supply Concerns
Oil prices slid with Brent down 1.2% to $67.21 and WTI down 1.3% to $62.73, as diplomatic signals from Washington and Tehran reduced fears of supply disruptions.

Too Much Knowledge, Zero Execution
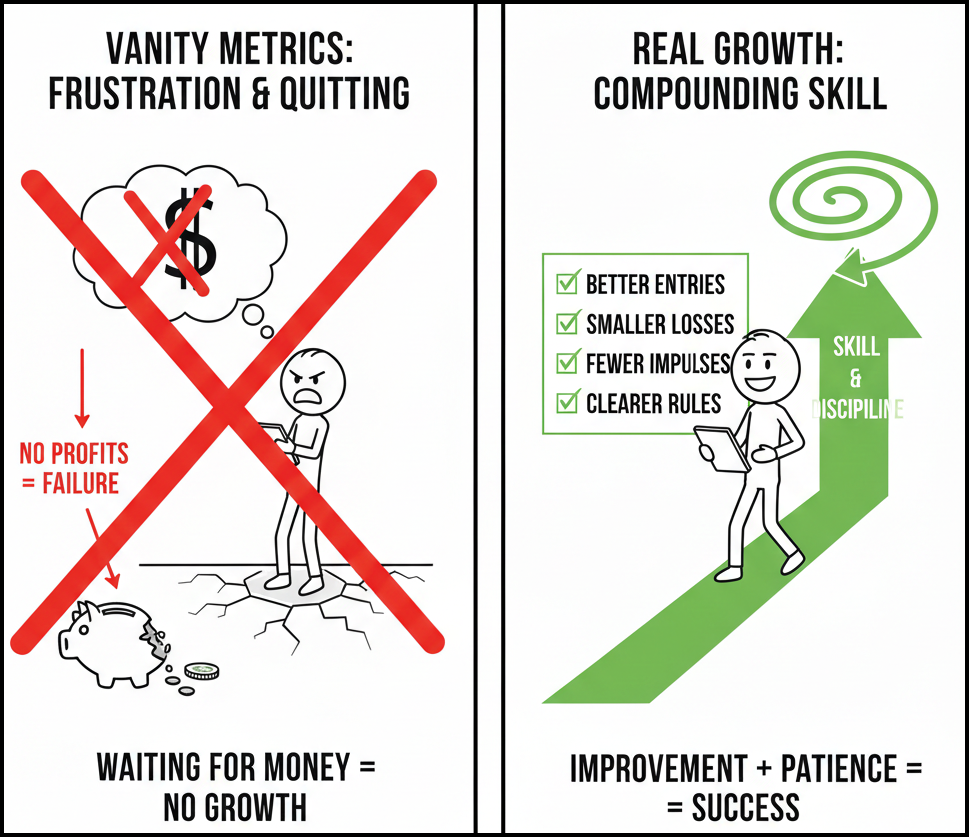
Most traders quit because they’re waiting for money to prove they’re improving. When profits don’t show up fast, they assume nothing is working.
But growth shows up first in quieter ways. Better entries. Smaller losses. Fewer impulsive trades. Clearer rules. These changes don’t look exciting, but they matter more than early wins.
Profit is a lagging result. Skill is the leading indicator. When you focus on improving decisions instead of chasing payouts, the money has room to follow.
If you want trading content that helps you recognize real progress and build skill without obsessing over daily P&L, these newsletters help. They reinforce process, discipline, and long-term improvement.

Zig Zag Indicator
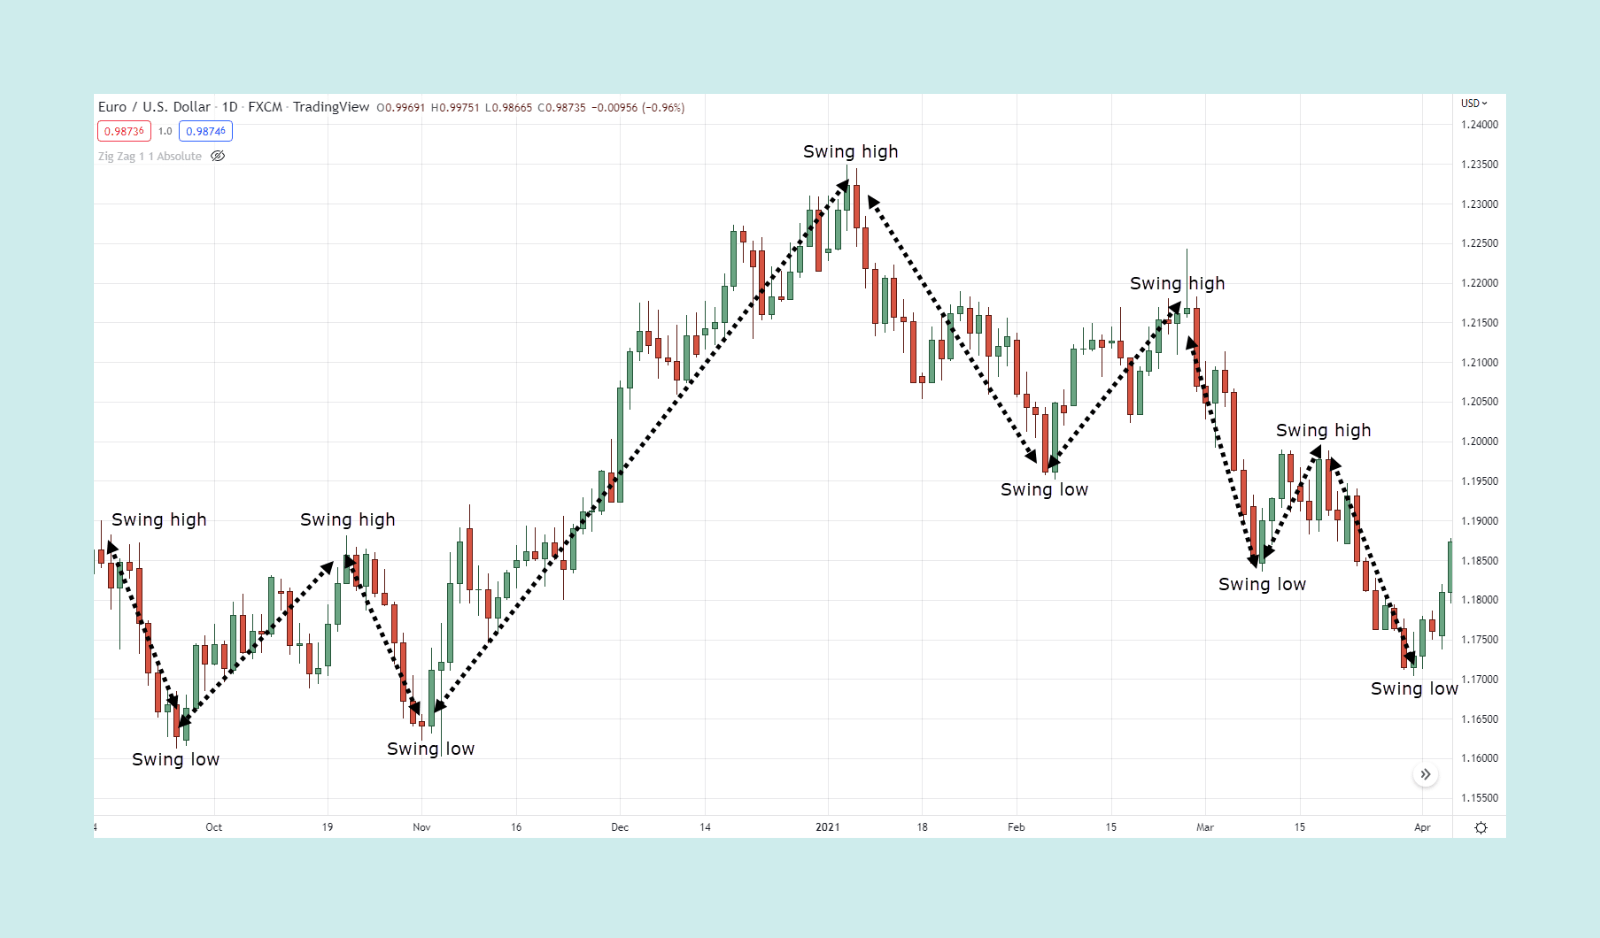
The Zig Zag indicator is a trend-following tool that filters out market "noise" and small price fluctuations. It only draws a line when the price moves by a specific percentage or amount (usually 5% or more). Its primary job is to simplify the chart so you can see the underlying structure of the market—specifically the higher highs and lower lows.
🛠️ The Strategy Logic
Use these logical triggers to identify the true market structure and filter out daily volatility:
- IF: The Zig Zag line is consistently forming "Higher Highs" and "Higher Lows"... * THEN: The market is in a structural uptrend. Ignore minor red candles; as long as the Zig Zag "leg" hasn't reversed, the path of least resistance remains up.
- IF: The Zig Zag line fails to make a new high and then breaks below the previous "Zig" (Low)...
- THEN: A structural trend reversal is confirmed. This is often the cleanest way to visualize a "Change of Character" in the market from bullish to bearish.
- THEN: A structural trend reversal is confirmed. This is often the cleanest way to visualize a "Change of Character" in the market from bullish to bearish.
- IF: You draw a Fibonacci Retracement over a completed Zig Zag "leg"...
- THEN: You can predict the next "Zag." The indicator helps you identify the start and end of a major move, making it much easier to see if a pullback has reached the 50% or 61.8% gold zones.
- THEN: You can predict the next "Zag." The indicator helps you identify the start and end of a major move, making it much easier to see if a pullback has reached the 50% or 61.8% gold zones.
- IF: The Zig Zag line forms a "Head and Shoulders" or "Double Top" pattern...
- THEN: The pattern is high-conviction. Because the Zig Zag filters out noise, a chart pattern that is visible on this indicator is much more significant than one hidden in a "messy" candlestick chart.
- THEN: The pattern is high-conviction. Because the Zig Zag filters out noise, a chart pattern that is visible on this indicator is much more significant than one hidden in a "messy" candlestick chart.
- IF: The current Zig Zag leg is significantly longer than the previous three legs...
- THEN: The move is likely reaching an exhaustion point. Momentum is overextended, and you should be on high alert for the next "reversal point" to be drawn.
💡 Pro Tip
The "Repainting" Reality: The most important thing to know is that the Zig Zag is a lagging indicator that "repaints." The most recent line will continue to move until the price reverses by your chosen percentage. Never enter a trade the moment a new Zig Zag line appears. Instead, use it as a map to find support and resistance levels from the previous completed legs, which are fixed and will not change.

The Screenshot Trap
You catch yourself thinking about how the trade will look before you think about how it will perform. Clean chart.
Perfect arrow. Nice entry circle. Something you can post later.
That shift looks small. It changes behavior fast.
You start favoring pretty setups over tested setups.
You hold past your exit because the move looks strong. You avoid partial profits because the final chart will look messy.
You skip boring trades that follow your plan because they feel unimpressive.
Now you trade for proof, not for pay.
Run a simple check before every order.
Would you still take this trade if nobody could see it.
Would you manage it the same way if screenshots were impossible.
Does this follow your written rules line by line.
Keep a private trade log with numbers and notes.
Entry reason. Risk. Exit quality. Mistakes. Fixes.
Stats build accounts.
Applause builds pressure. Only one of those compounds.


