
Alphabet Nears $4T
....................................................................................................................


Good morning!
Some weeks the market gives you drama.
This week? It’s giving a full comeback storyline.
After two strong sessions, Wall Street is walking into Wednesday with its chest out and futures pointing higher.
The Dow is ticking up 0.3%, the S&P 500 is adding 0.4%, and the Nasdaq is climbing 0.5% — a quiet confidence after Tuesday’s 660-point rocket launch in the Dow.
Tech is still steering the ship: Alphabet ripped to new all-time highs on talk that Meta may lean on Google’s TPU chips by 2027, while Nvidia stumbled as investors questioned whether its AI throne is as secure as it looks.
And the fuel behind the rally?
Rate-cut hopes. An 85% chance of a December cut has traders exhaling for the first time in weeks.
It’s a holiday-shortened week, most of the big data is already out, and now the market is settling into that “don’t ruin the vibe” mode.
The only thing left to see: can this momentum make it to the finish line?

📉 Markets Sink Even as Nvidia Smashes Earnings
Wall Street tanked despite Nvidia’s blockbuster quarter, as hotter-than-expected jobs data and sticky inflation revived fears the Fed may delay rate cuts — triggering a wave of tech profit-taking that swept across global markets.
🚨 SoftBank Tanks on OpenAI Doubt
SoftBank shares plunged over 10%, sliding nearly 40-45 % from recent highs as investors fretted that tough competition for OpenAI could undercut future returns.
💥 Nio Tumbles on Weak Q4 Forecast
The EV maker sank after Wall Street trimmed price targets - a reminder that growth expectations are fragile when macro and valuation risks bite.
🚗 Tesla Struggles as Sales Momentum Wanes
Tesla’s stock fell after signs of cooling demand and softer delivery trends - a warning that even EV giants aren’t immune in this shaky market.
💻 HP Plunges Into AI — Job Cuts Underway
HP is investing heavily in AI infrastructure even if it means cutting thousands of jobs - a bold gamble as uncertainty grips tech spending.
🤖 Alphabet Nears $4T Market Cap as AI Surge Fires Up Markets
Alphabet’s stock raced as much as 5 % this week, pushing its market cap close to US $4 trillion, as investors bet big on its AI‑push — boosted by interest from rivals shifting to Google’s chips and fresh momentum from its new Gemini AI tools.
🪙 Gold Rises as Dollar Softens
Gold edged higher in Asian trading as the dollar slipped for a second straight session, boosting demand and adding fuel to bets that a U.S. rate cut could land before year-end.

Protect Your Money With Knowledge, Not Fear
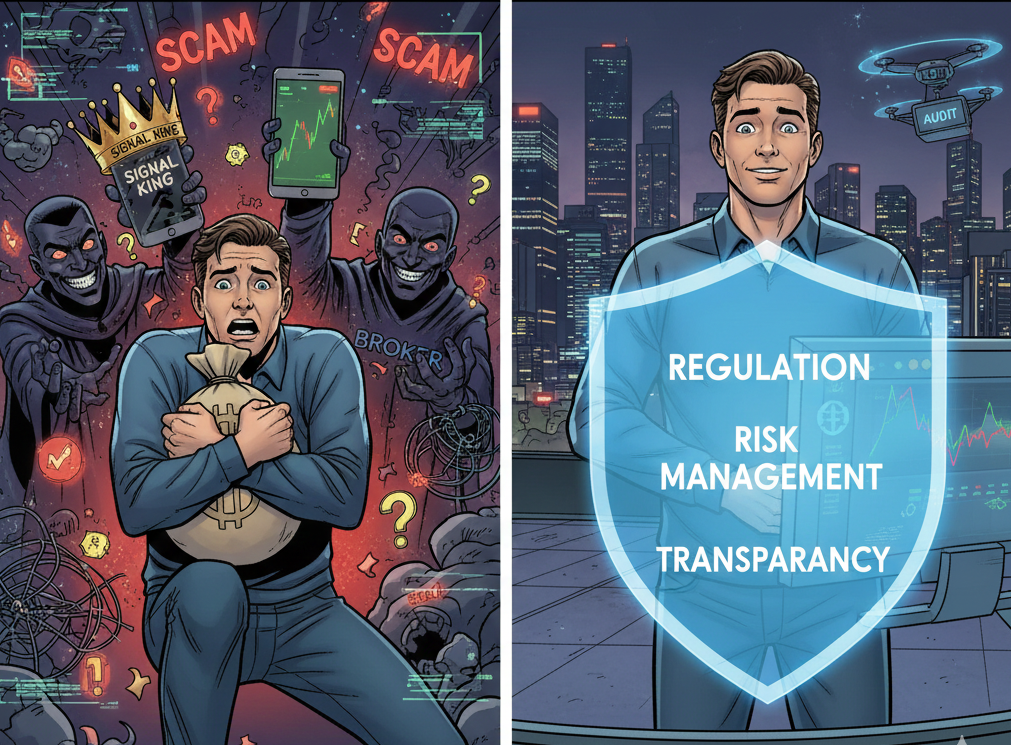
Many new traders hesitate because scams feel everywhere.
Fake brokers. Signal sellers. Influencers who promise returns no real trader can reach.
That noise creates fear. You avoid the market to avoid being tricked.
The solution is not hiding. It is understanding how real trading works. Legit brokers follow regulations and provide clear terms.
Real strategies show risk, not guarantees. Real traders explain process, not miracles.
When you know what to look for, the red flags stand out. You protect yourself through clarity, not suspicion.
Knowledge removes the fear that keeps you stuck.
You step into the market with confidence instead of caution.
If you want guidance that helps you stay safe and learn what real trading looks like, these newsletters help. They break down the basics in a simple way so you avoid scams and focus on real skills.

Accumulation/Distribution Line (A/D Line)
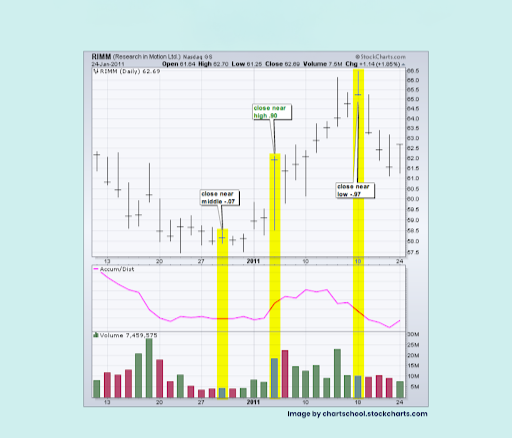
The Accumulation/Distribution Line (A/D Line) is a volume-based indicator developed by Marc Chaikin to measure the cumulative flow of money into and out of an asset.
It is based on the premise that the relationship between a period's closing price and its high/low range, when weighted by volume, can reveal the underlying buying pressure (accumulation) or selling pressure (distribution).
It is a cumulative running total, meaning the current value is built upon all previous values.
The absolute value of the A/D Line is not important; the slope and direction of the line relative to the price are what provide the key signals.
What to Look For (Key Features and Signals)
The A/D Line is calculated by determining a Money Flow Multiplier (based on where the close is relative to the period's range), multiplying it by the volume, and then adding that Money Flow Volume to the previous A/D Line value.
- Trend Confirmation: The simplest use is to confirm the strength and sustainability of the current price trend.
- Bullish Confirmation: When the price is rising, the A/D Line should also be rising. This means volume is heavier on days when the price closes in the upper half of its range, confirming strong accumulation.
- Bearish Confirmation: When the price is falling, the A/D Line should also be falling. This means volume is heavier on days when the price closes in the lower half of its range, confirming strong distribution.
- The Power of Divergence (Key Reversal Signal): Divergence is the most powerful signal, as it suggests volume is contradicting the price movement, signaling an impending reversal.
- Bullish (Positive) Divergence: The asset's price makes a lower low, but the A/D Line makes a higher low (or refuses to fall further). This signals hidden accumulation by strong buyers despite the falling price, often preceding a bullish reversal.
- Bearish (Negative) Divergence: The asset's price makes a higher high, but the A/D Line makes a lower high (or fails to follow price higher). This signals hidden distribution by major sellers despite the rising price, often preceding a bearish reversal.
- Breakout Anticipation: When the price is consolidating in a tight range, a rising A/D Line suggests silent accumulation is taking place and warns of a potential upward breakout. Conversely, a falling A/D Line suggests distribution and warns of a potential downward breakout.
- Intraday Strength: The A/D Line is primarily interested in where the price closes relative to the day's high/low. A strong close near the high of the day will push the A/D line up significantly, regardless of whether that close was higher or lower than the previous day's close.

Process Addiction vs Trade Addiction
Every trader leans toward one of these paths.
One leads to stability. The other leads to chaos.
The difference is subtle, but the outcomes are not.
Trade addiction is the urge to always be in a position.
You keep clicking because the silence feels uncomfortable.

You chase movement because stillness feels wrong. You look for setups that are not there. You treat the market like entertainment instead of a business.
This habit destroys accounts because it turns trading into impulse.
No structure. No standards. No edge.
Process addiction is the opposite.
You get hooked on the routine.
You enjoy the preparation. You study your levels. You wait for your conditions.
You trade less, but your trades have weight.
You build a system that can survive a year, not a week.
Over time, this mindset compounds in your favor.
One path feeds your dopamine. The other feeds your future.
Your results show which one you follow.


