You’ve Been Fooled by the Market Rally!


The financial landscape is anything but calm.
One minute we're cheering at new highs, the next we're clutching our seats as we plummet.
The market's playing hard to get, and it's leaving investors dizzy.
Let's cut through the noise and highlight the latest market movers and uncover the trends shaping your portfolio.

👻 Japan Stock Market Early Rally Fades
The Nikkei's recent decline has dashed the hopes of investors who were initially optimistic after the market crash. Is this a temporary setback, or a sign of deeper trouble ahead?
📺 Unending Troubles For Warner Bros.Discovery
Warner Bros. Discovery has made a staggering $9 billion error in valuing its TV networks. This financial fiasco raises serious questions about the company’s future.
🚀 Data Says “US Stocks Expected To Rise”
Markets are getting wild! Stocks are up, yields are down, and currencies are all over the map. What's driving this chaos?
🇨🇳 The Chinese Yuan is sending the market into a frenzy
China's yuan meltdown is spreading panic. Will it trigger a global market collapse, or is this a buying opportunity?
♟️ The Best Investment Moves To Make Now Amidst Stock Market Selloffs
Savvy investors see opportunity in chaos. See the essential strategies to protect your wealth and emerge from this downturn stronger than ever.
🏬⛔ Up to 315 Big Lots Stores Face Potential Closure
Retail alert!
Big Lots may close 315 stores. Find out what's driving this decision.
💵 Anduril is Worth $14 Billion Now
Anduril just got a big price tag of $14 billion. What's behind this big money? Find out in this article.

Stochastic Oscillator

The Stochastic Oscillator works similarly in the market, comparing a stock's closing price to its recent price range to gauge its momentum.
It's a handy tool for spotting potential overbought or oversold conditions and predicting trend reversals.
How it Works:
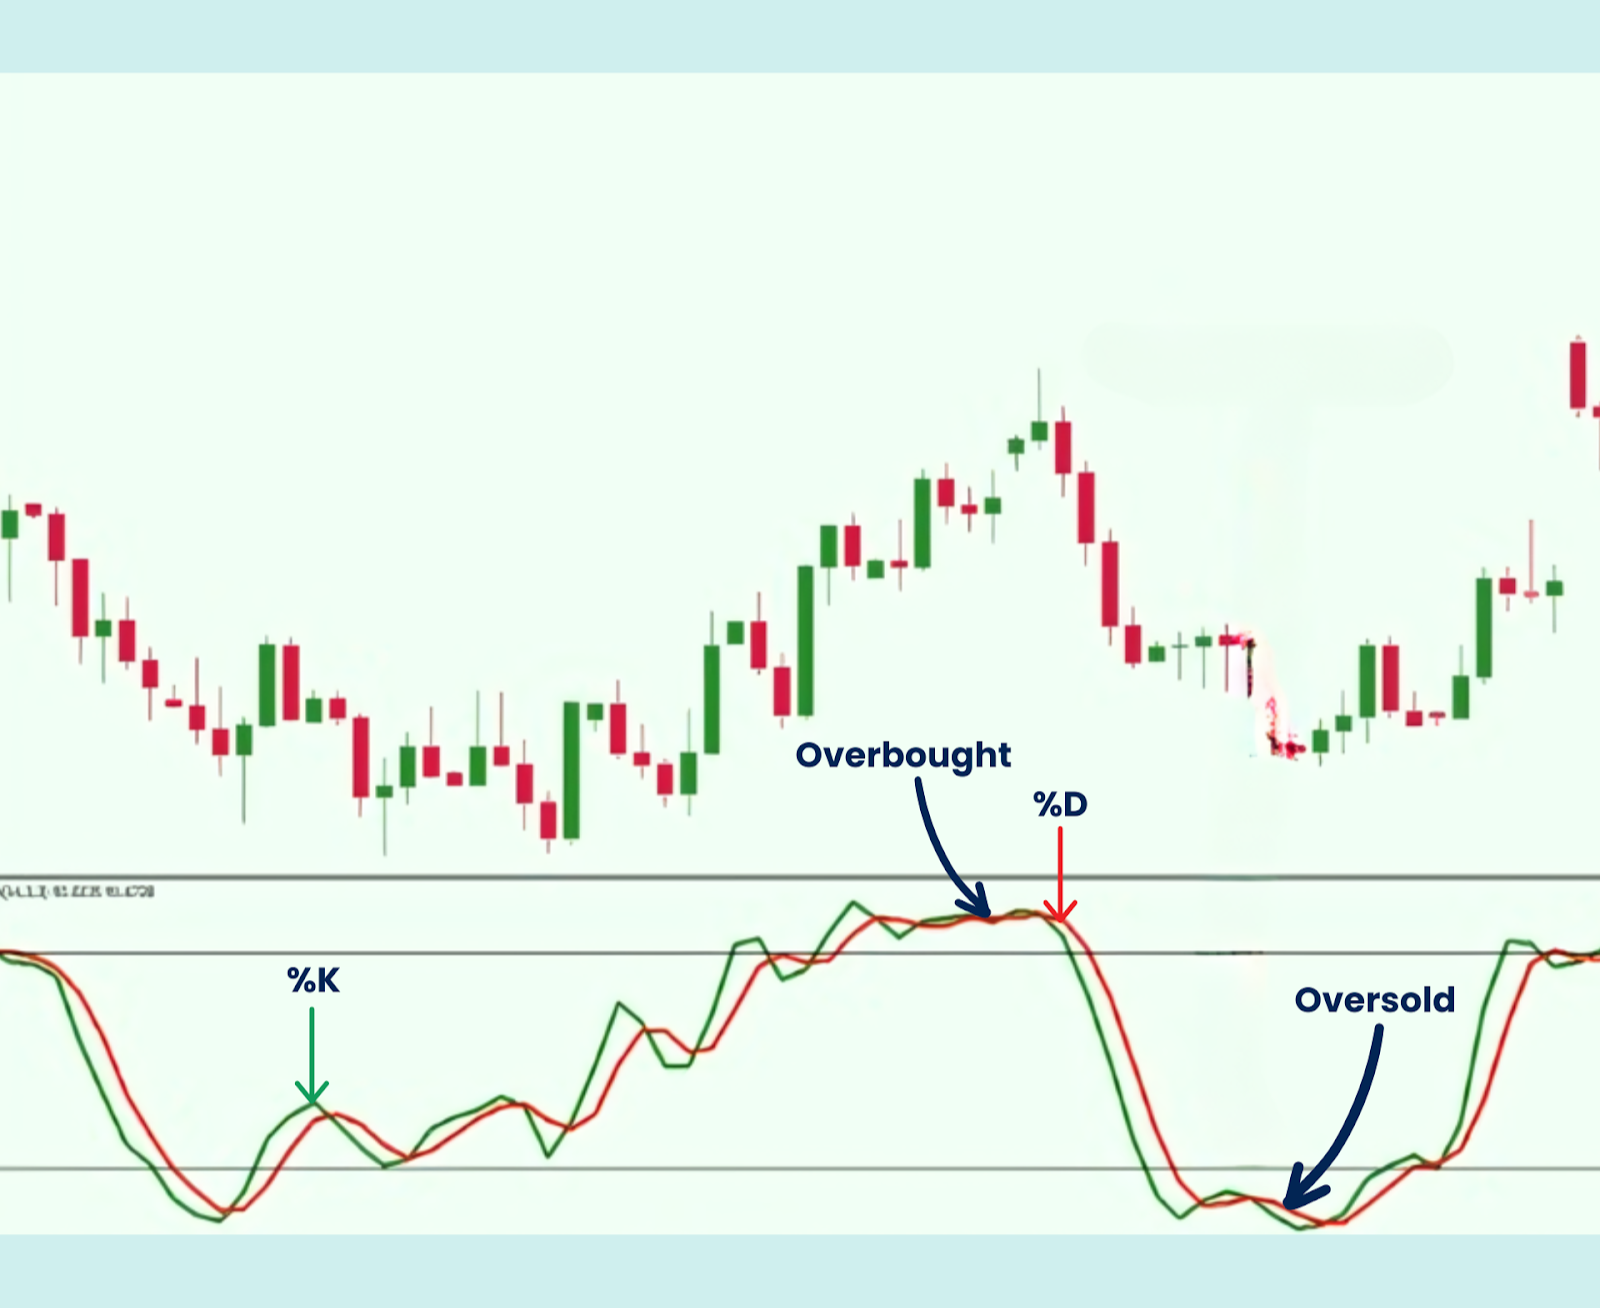
The Stochastic Oscillator consists of two lines:
- %K line: Measures the current closing price relative to the high-low range over a specified period (usually 14 periods).
- %D line: A moving average of the %K line, acting as a signal line to filter out noise.
Both lines oscillate between 0 and 100, with readings above 80 generally suggesting an overbought market and readings below 20 suggesting an oversold market.
What to Look For:
- Overbought/Oversold Signals: When the %K line crosses above 80, it could indicate the market is overbought, suggesting a potential price pullback. Conversely, when the %K line crosses below 20, it could mean the market is oversold, hinting at a possible price bounce.
- Crossovers: When the %K line crosses above the %D line, it's often seen as a bullish signal, while a cross below is considered bearish.
- Divergence: If the Stochastic Oscillator diverges from the price (e.g., the price is making higher highs while the oscillator is making lower highs), it could signal a weakening trend.

We've all heard it: “discipline is the key to trading success”.
But let's be honest, it's easier said than done.
We nod in agreement, determined to be the disciplined trader we know we should be.
Yet, when the market turns against us, those good intentions often evaporate faster than morning dew.
Why is it so hard to stick to our plans?
Is it really just a lack of discipline? Or something deeper?
The truth is, while discipline is important, it's often not the root of the problem.
It’s about understanding the underlying psychological patterns that sabotage our best intentions.
We’ll dive deeper into this in upcoming issues.
But for now, let’s challenge the notion that discipline is the sole determinant of trading success.
We need to understand the real reasons behind our inconsistent behavior and discover strategies to overcome them.
For this and more, we’ve got you covered, stay tuned for more insights from Trading TDLR!


