
Watch Microsoft
....................................................................................................................


It’s Friday - but don’t bother refreshing those US charts, the market’s taking the day off.
The US is closed for Independence Day 🇺🇸 - fireworks, BBQs, and one rare moment where traders actually have to sit still (or at least pretend to).
But the rest of the world?
Still moving.
Asia’s ticking, Bitcoin’s lurking near highs, trending US Vietnam trade deal and global headlines aren’t exactly taking a holiday.
So even with Wall Street quiet, we’ve got the crucial updates lined up.

📈 Nasdaq and S&P 500 Hit Records on Tech Surge, Vietnam Trade Deal
Wall Street closed mixed as tech giants powered to fresh highs while investors cheered easing trade tensions. Markets now eye key jobs data for clues on when the Fed might finally cut rates.
🪟 Can Microsoft’s Nuclear Play Supercharge Its Stock?
As AI pushes power grids to the limit, Microsoft is racing to bring Three Mile Island’s reactor back online. With demand soaring and growth in Azure blazing, could nuclear energy be the catalyst that sends MSFT to new highs?
📉 Footwear Fumble? Goldman Turns Bearish on Deckers and Crocs
With Deckers down 50% YTD and Crocs demand cooling, Goldman Sachs urges caution. Tariff deals may help, but analysts see tough competition and slower growth killing the rally hopes.
🚗 Tesla Stock Rebounds Despite Delivery Miss as Bulls Bet on Robotaxis
Shares snapped a six-day losing streak even after Q2 deliveries fell short. Analysts say early Model Y demand and autonomous driving milestones could drive the next big rally.
🪙 Bitcoin Hits $109.7K But Pro Traders Stay on the Sidelines
Despite brushing all-time highs, futures and options data reveal muted bullish bets. With stablecoin discounts in China and ETF outflows, market anxiety over trade wars and recession looms large.
💪 Markets Brace for Weeks of Wild-Card Shocks as Tariffs, Jobs Data Loom
Big investors are warning that a calm façade masks a minefield of surprises. From US-EU tariff talks to French budget votes and volatile jobs data, assets from gold to corporate credit are poised for whiplash.
🏯 Asian Shares Climb as Wall Street Sets New Records on Tesla, Nike Rally
Markets from Seoul to Mumbai gain ground after S&P 500’s third record in four days. Vietnam trade deal fuels optimism despite tariff risks, boosting import-heavy stocks like Nike.

No new recommendations today.
The US market is closed for Independence Day 🇺🇸
So we’re sitting tight.
Still monitoring our open positions.
And as always - I'll update you the moment a new opportunity shows up.
Stay tuned.

If Grandpa Can Use WhatsApp, You Can Learn Trading Tech

Tech fear is real but let’s be honest, it’s often more about mindset than machines.
If you’ve ever looked at a trading platform and thought, “I’ll need a PhD to figure this out,” you’re not alone.
But here’s what you need to know: modern trading tools are becoming more intuitive than ever.
You don’t need multiple monitors or a background in computer science - you just need the right guide.
That’s where these trading newsletters come in.
They simplify the tech talk, walk you through tools step-by-step, and show you exactly how to trade confidently - no jargon, no overwhelm.
If you’re tired of tech holding you back, these newsletters will help you trade smarter - without needing to become a software engineer.
👉 Start learning the simple way

Three Black Crows
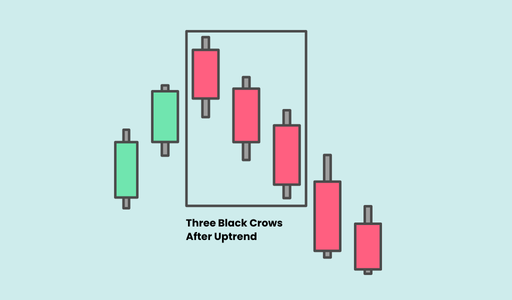
The Three Black Crows is a bearish reversal candlestick pattern that occurs after an uptrend.
It signals that sellers are taking strong control, suggesting the price is likely to move lower.
What to Look For:
- Three Consecutive Bearish Candles: The pattern consists of three red (or black) candles in a row.
- Each Opens Within Previous Body: The open price of each candle should be within the body of the preceding candle.
- Each Closes Lower: Each candle should close lower than the previous one, ideally near its low. This shows sustained selling pressure.
- Relatively Long Bodies: All three candles should have substantial bodies, indicating significant price movement during each period. Small or absent upper shadows suggest strong downward momentum.
- Appears After Uptrend: This pattern is a strong reversal signal when it forms after a clear period of rising prices.
- Suggests Seller Strength: It strongly indicates that buyers are exhausted and sellers are aggressively pushing prices down.
- Confirmation: While strong, further confirmation from the next trading period or other technical indicators (like a volume increase or breakdown from a support level) can enhance its reliability.


It’s Friday — the 4th of July in the U.S. Fireworks, speeches, flags everywhere.
People love to talk about freedom today.
But traders know real freedom isn’t just a holiday, it’s how you move in the market.
Ask yourself - are you trading free? Or trapped?
- Trapped in emotional trades.
- Chained to fear of missing out.
- Stuck reacting instead of leading.
Freedom in trading means control.
“ It means structure protects your capital, not impulse. It means your plan decides your next move — not the noise, not the crowd. It means walking away when the setup’s not there, with no hesitation.”
Anyone can celebrate freedom today.
But few trade like they’re free — clear, confident, untouchable by the market’s chaos.
Enjoy the day, enjoy the opportunity. And wherever you are, trade with clarity, trade with control — trade free.
Happy 4th of July.


