
Warning! Market Pullback Near
....................................................................................................................


Whew — this market woke up with a headache 😬
Tough day in tech land and the market is still feeling it. Futures are mixed this morning after yesterday’s sharp selloff sent all three major indexes into the red. The Nasdaq is dragging again as AMD slipped post-earnings despite beating the numbers, reminding traders that in an AI-obsessed market good is no longer good enough.
Macro nerves are creeping in too. A historic government shutdown is choking data flow, CEOs are openly warning about a potential correction, and the Supreme Court is weighing the future of Trump’s tariffs - a decision that could ripple through global markets.
Meanwhile, traders are eyeing fresh labor and services data to see whether the soft-landing narrative can hold.
It’s one of those mornings where the market isn’t panicking, but it is questioning. Stay level, stay selective, and watch how sentiment shifts off the open.
Now into the key moves 👇

🚨 CEOs Warns of 10-15% Market Pullback
At a global finance summit, leaders from Morgan Stanley and Goldman Sachs warned that markets could see a 10-15% correction over the next 12-24 months, citing stretched valuations and tech surges.
❗ Palantir Technologies Drops 8% After Rally
Palantir shares slid nearly 8 % despite strong results, as investors flagged its lofty valuation (trading at hundreds of times forward earnings) and the broader AI hype under-pressure.
🔥 AMD Crushes Q3: $9.25 B Revenue, $1.20 EPS
AMD posted Q3 revenue of roughly US $9.25 billion and EPS of US $1.20, both above expectations, while signalling strong AI-data-centre momentum heading into Q4.
📈 Big Tech’s AI Bill: $350B This Year and Growing
The major tech giants are expected to spend around US $350 billion this year on AI infrastructure alone, with global AI-capex projected at US $4 trillion by 2030—fueling bullish excitement and bubble-talk alike.
💥 $1.3B Liquidated as Bitcoin Dips Below US $104K
Bitcoin tumbled under US $104,000, sparking roughly US $1.3 billion in crypto-liquidations in 24 hours as leveraged traders got hit hard and sentiment swung risk-off.
💵 Dollar Hits 3-Month High as Rate-Cut Odds Slide
The U.S. dollar climbed to a three-month peak, as traders dialled back bets on an imminent Federal Reserve rate cut—signalling less confidence in a quick soft-landing scenario.
✊Gold Holds Its Ground Amid Risk-On Shift
Even with the stronger dollar and elevated risk-assets, gold’s steady performance shows it’s acting more as a “hedge in transition” than a runaway safe-haven—a subtle signal that traders are weighing both opportunity and uncertainty.

AutoZone Inc (NYSE: AZO)
AutoZone just completed a healthy retracement into our key zone.
The candles show exhaustion from sellers, and momentum is crossing back up.
Giving us a sweet 4C alignment for a potential bounce.
🎯 Targets:
Buy: $3649.36
TP1: $3747.36
TP2: $3843.12
Trade Update 💥
Immix Biopharma Inc (NASDAQ: IMMX) - TP Hit
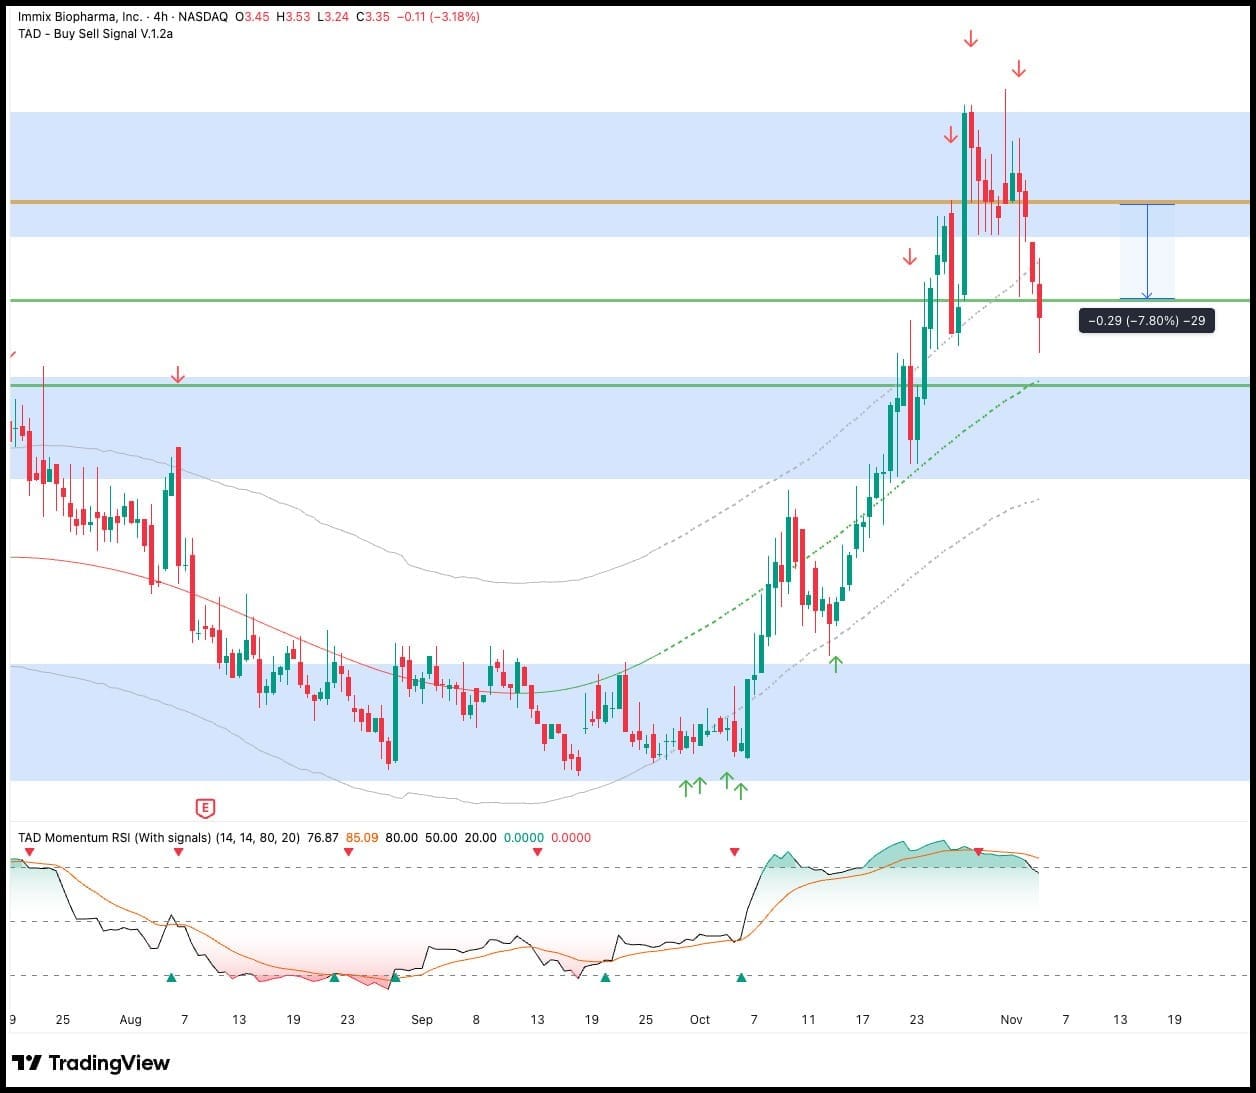
This one slid down sharply just as momentum flipped.
A textbook setup — out of band, red arrows, RSI crossover.
Locked in a gain of 7.80% before leverage.
One of the biggest gains ever!
...........................
AutoZone Inc (NYSE: AZO) - TP Hit (Updated)!
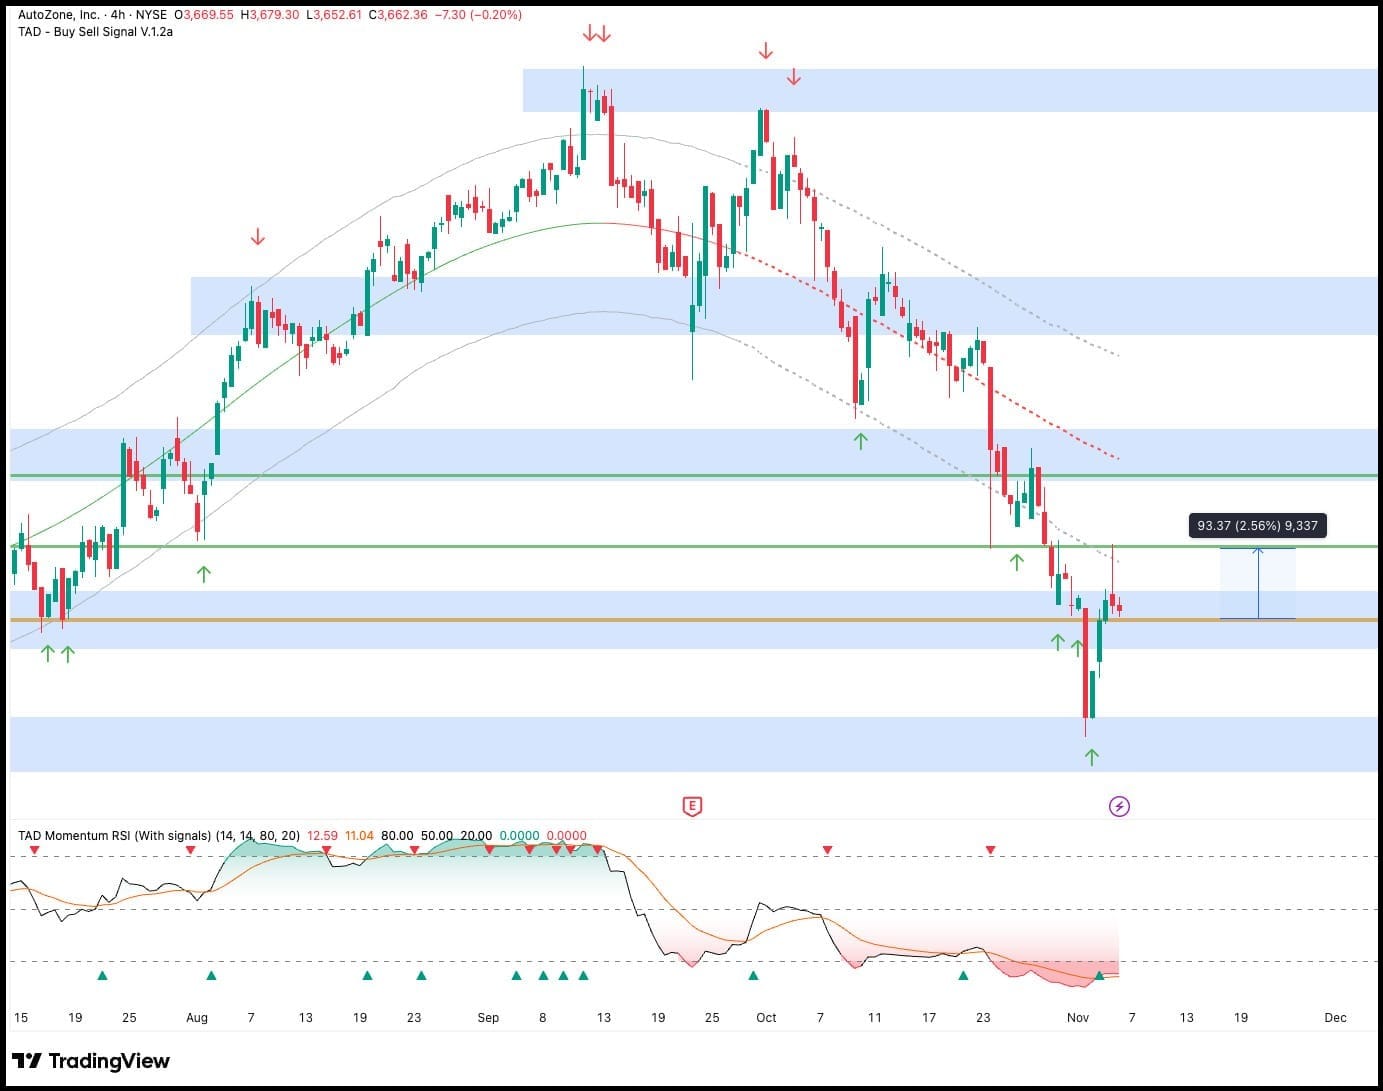
The bounce we anticipated came in strong.
From our buy zone, price shot up quickly to hit TP in just a few sessions.
Locked: 2.56% gains before leverage.

Don’t Fear Volatility — Study It

Volatility - it’s the word that sends chills down most traders’ spines. The market spikes, dips, and suddenly everything feels unstable. You start doubting your setups, second-guessing your entries, or worse - avoiding trades altogether. It’s not that you don’t want to trade; it’s that the chaos feels personal. Every price swing feels like it’s out to get you.
But here’s the thing - volatility isn’t your enemy. It’s the market’s heartbeat. Without it, there’d be no movement, no opportunity, no growth. The traders who win long-term don’t pray for calm seas; they learn to surf the waves. They understand that volatility is where profits hide — behind fear, hesitation, and uncertainty.
If every spike makes you panic, it’s not the market you need to fix — it’s your mindset. Volatility doesn’t demand perfection; it demands preparation. When you have a plan, proper risk management, and emotional discipline, volatility turns from something to fear into something to leverage.
Because here’s the truth: the biggest wins don’t happen when the market’s quiet - they happen when everyone else is too scared to trade.
Explore the newsletters and insights that’ll help you master volatility:
👉 Don’t just watch the swings - learn to surf them.

Symmetrical Triangle
The Symmetrical Triangle is a popular and neutral chart pattern that signals a period of consolidation or market indecision.
It appears when the price action is squeezed between two converging trend lines. The market is effectively in balance: buyers are stepping in at higher lows, while sellers are entering at lower highs.
The tightening price range indicates that both supply and demand are equally matched, leading to a temporary stalemate before a sharp directional move occurs.
It is often treated as a continuation pattern, meaning the price will usually break out in the direction of the prior trend, but traders must wait for the actual breakout for confirmation.
What to Look For (Key Features and Signals)
- Pattern Shape: The pattern is formed by two converging trend lines that create a triangle shape. The upper line slopes downward (connecting lower highs), and the lower line slopes upward (connecting higher lows).
- Neutrality: The key characteristic is its neutrality. Unlike rising or falling wedges, the Symmetrical Triangle doesn't inherently favor a bullish or bearish breakout. The breakout direction is determined by the strength of the preceding trend or external factors.
- Volume Trend: Trading volume should ideally decrease as the price moves deeper into the pattern, reflecting the market's indecision and loss of momentum. This lower volume is a sign of healthy consolidation.
- Breakout Area: The breakout is most reliable if it occurs between one-half and two-thirds of the way through the pattern (before the apex). If the price consolidates all the way to the tip (apex), the signal is often weak and unreliable.
- Breakout Confirmation: The pattern is confirmed when the price breaks decisively above the upper trend line (for a bullish move) or below the lower trend line (for a bearish move). This breakout should be accompanied by a noticeable spike in volume to validate the signal.
- Target Price: The traditional price target is calculated by measuring the widest part of the triangle (the distance from the first high to the first low) and projecting that distance in the direction of the breakout from the point where the price exits the triangle.

Emotional Compounding
One emotional trade rarely destroys a trader.
The real damage comes from what happens next.

A loss hits your ego.
You feel embarrassed.
You want the money back fast.
So you chase.
You size up.
You ignore your plan. 😐
You start trading to fix a feeling, not to find a setup.
That is how accounts die. Not in a moment, but in a spiral.
The first emotional mistake is the spark.
The revenge trade that follows is the fire.
Then comes frustration, doubt, refusal to stop, refusal to breathe.
You are no longer trading the chart.
You are trading your anger, your pride, your fear.
And the market does not care.
Smart traders do not focus on avoiding every emotional slip.
They focus on stopping the chain reaction.
One mistake can be contained. Five in a row becomes destruction.
The most profitable move after a dumb trade is not another trade.
It is distance.
Step away.
Reset.
Regain your mind before you risk your money again.
Emotional control is not about never breaking. It is about breaking without shattering.
Stop the spiral early.
That is where real discipline lives.


