Volatility Drives Gold Higher
....................................................................................................................


Hello traders, it’s Monday - time to jump back in!
After a relaxing weekend, let’s recap last week’s whirlwind.
Trump paused most tpariffs for 90 days, except on China, fueling a huge rally - the Dow soared nearly 3,000 points Wednesday, adding trillions to the markets.
But stay sharp: China’s hitting back with 84% tariffs, so the trade war’s still simmering.
Bitcoin’s holding steady around $84,000, while Ethereum’s lingering near $2,000.
Gold’s shining at record highs, and stablecoins are gaining traction.
With volatility keeping us on our toes, let’s trade wisely and make this week count.
Stay tuned for what’s next!

📱 Apple Leads Tech Rally Amid Tariff Relief
Apple's strong performance lifts the 'Magnificent Seven' stocks, marking a positive turn after market turbulence linked to tariff concerns.
🇪🇺 European Stocks Face Weekly Losses
Investor sentiment remains cautious as European shares head for a third weekly decline, influenced by ongoing tariff disputes.
📈 Dow Surges 600 Points Amid Tariff Turmoil
U.S. stocks rally as the Dow jumps 619 points, capping a volatile week marked by escalating U.S.-China trade tensions and investor optimism over potential resolutions.
🚀 Gold Hits Record High Amid Market Volatility
Amid escalating trade tensions and market instability, gold notches its strongest weekly performance in five years, reaching unprecedented price levels at $3,200.
💪 Bitcoin Holds Strong Amid Dollar Weakness
Bitcoin maintains its position above $82,000 as the U.S. dollar index dips to a three-year low, signaling potential bullish momentum for the cryptocurrency.
🆙 Historic Wall Street Chaos Ends with Wild Swings!
Wall Street experienced another rollercoaster day on Friday, capping a historic week filled with market volatility. U.S. stocks soared, with the S&P 500 up 1.8%, but concerns about the ongoing trade war and Treasury yields signaled that fear is still gripping the markets.
⛽ Oil Price Slump Signals Potential Savings at the Gas Station
With oil prices dipping below $60 per barrel for the first time since the pandemic, experts forecast a decrease in gasoline prices, offering potential savings for drivers.

Pharma Stocks in Focus Today
All of today’s picks are from the pharma sector.
While the rest of the market is still looking shaky, it looks like pharma might be the first to recover.
The charts are starting to show strength, and we’re stepping in early to catch the move.
Let’s dive into today’s setups. 🚀
Eli Lilly and Company (NYSE: LLY)
Eli Lilly isn't waiting for the market to wake up - it's already showing signs of strength.
After holding firm through the recent chop, it’s starting to break higher.
Big names like this don’t move without reason, and we’re buying in while the momentum is still building at $731.93.
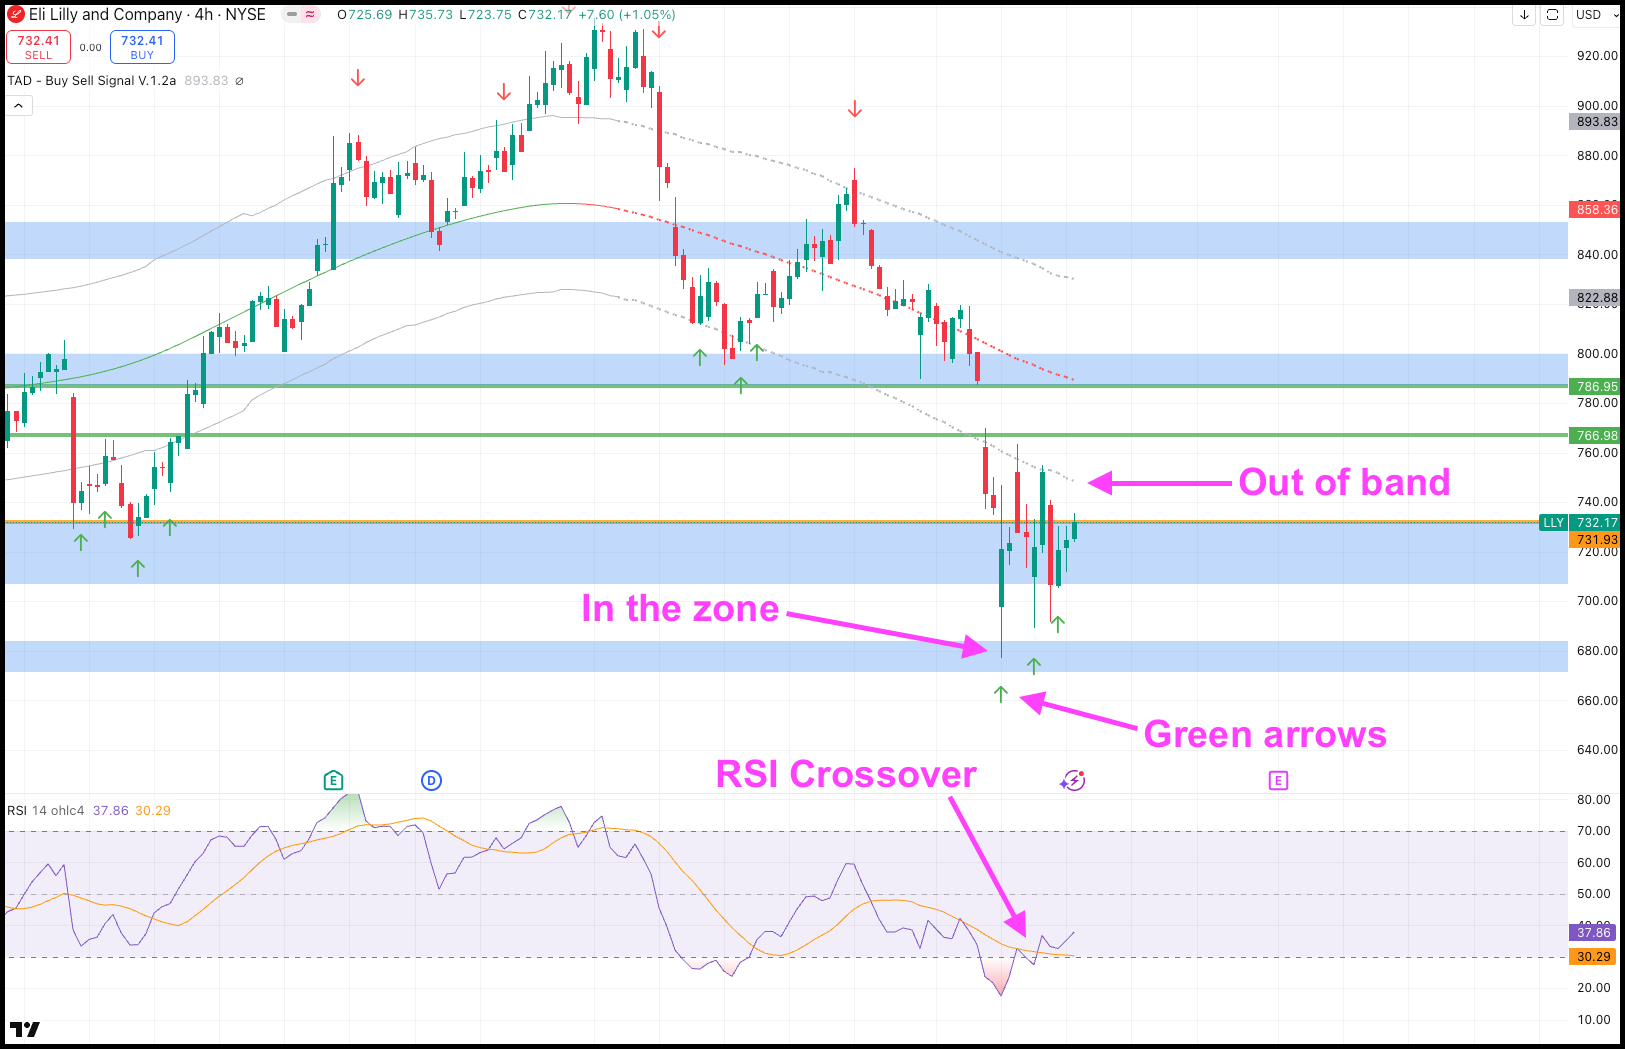
🎯 Targets:
Buy: $731.93
TP1: $766.98
TP2: $786.95
Thermo Fisher Scientific Inc. (NYSE: TMO)
Thermo Fisher has been quietly grinding higher, setting up a strong base.
Now, it’s starting to lift off. Went for a buy at $437.94.
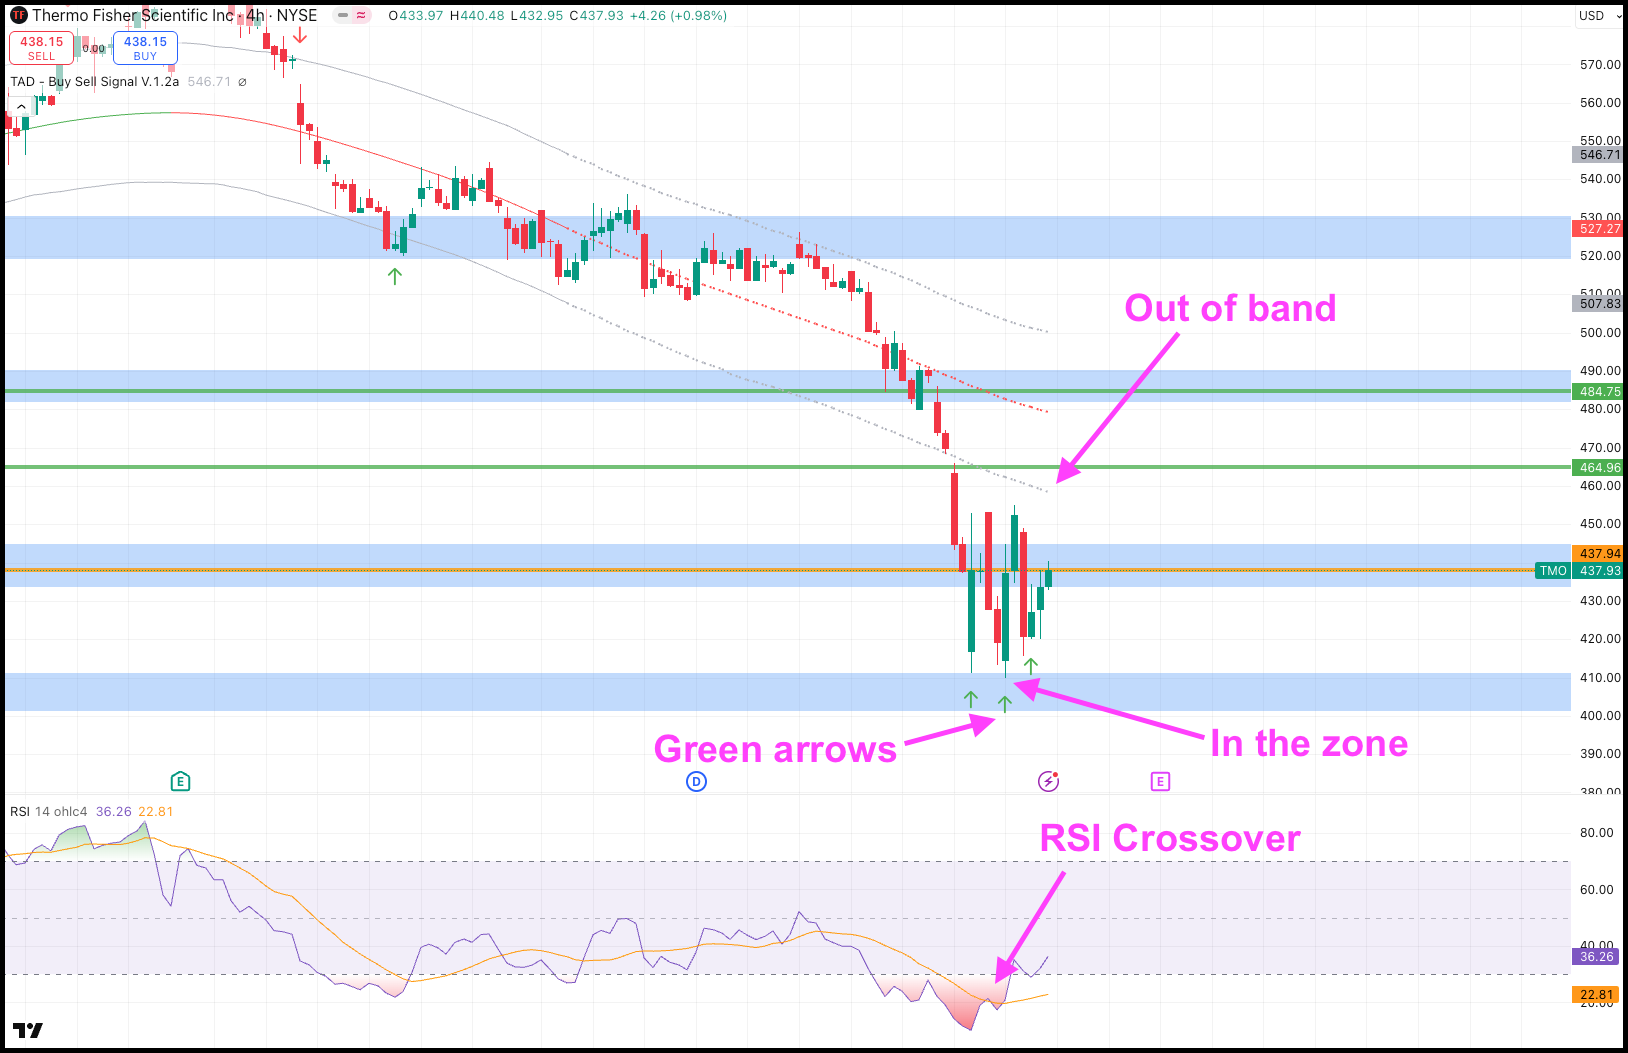
This is the kind of steady, quiet strength that often leads the next big move.
And we’re stepping in before the rest of the market catches on.
🎯 Targets:
Buy: $437.94
TP1: $464.96
TP2: $484.75
AstraZeneca PLC (NASDAQ: AZN)
AstraZeneca has been sleeping - but not anymore.
It’s bouncing off a major level with buyers showing up again hence we ride the wave and buy at $66.25.
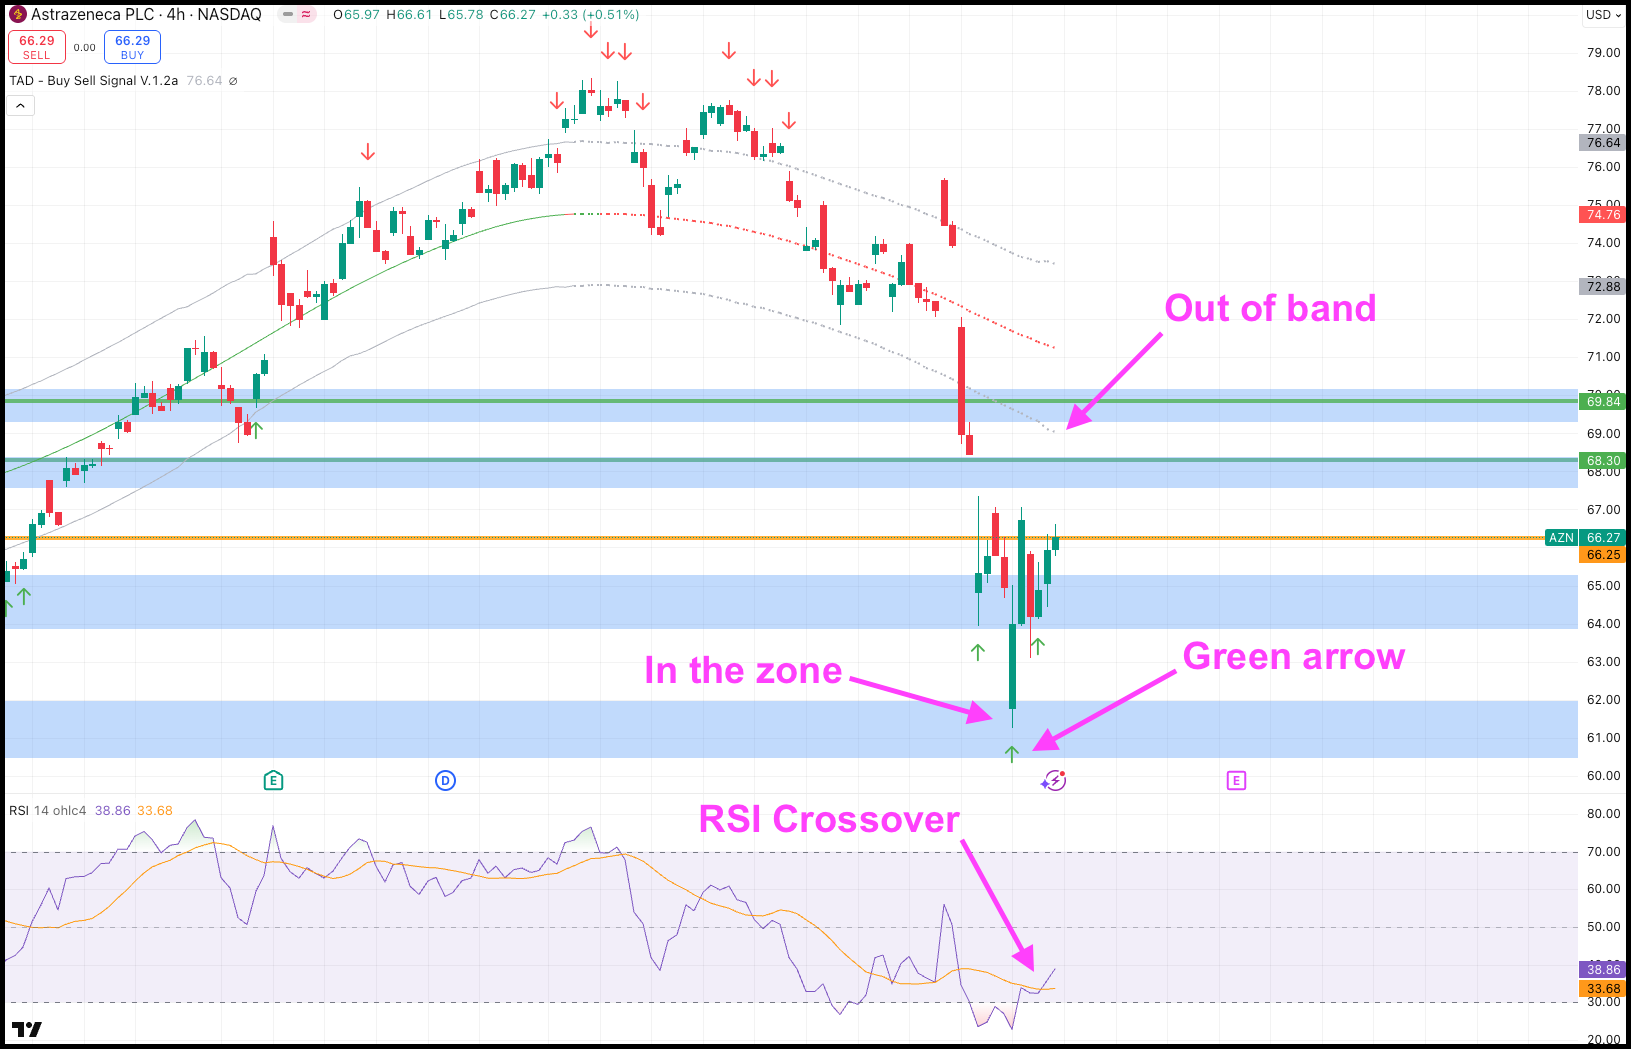
This early move hints that the bigger players might be positioning, and we’re jumping in alongside them for the next leg up.
🎯 Targets:
Buy: $66.25
TP1: $68.30
TP2: $69.84
Three different setups.
One common thread — pharma is gearing up to take the spotlight.
The market’s still asleep, but this sector is already lacing up its running shoes.
Let’s catch the move before the starting gun goes off. 🚀

Trading Isn’t a Scam - You Just Need a Strategy That’s Not Built on Hype

It’s easy to be skeptical when every corner of the internet is shouting about overnight millionaires and “secret” trading formulas.
But real trading success doesn’t come from hype - it comes from understanding smart, repeatable strategies.
These trading newsletters don’t promise yachts and private jets.
Instead, they break things down with clear, honest insights that help you see what actually works.
No fluff.
No fairy tales.
Just practical advice you can apply today, even if you're starting with doubts.
If you’re tired of the hype and just want the truth about trading, these newsletters will give you the clarity you’ve been looking for.
Click here to get these gems 💎

Parabolic SAR

Parabolic SAR (Stop and Reverse) is a technical indicator used to identify potential reversal points in the price direction of an asset.
It places dots above or below the price bars, indicating potential stop-loss levels and trend direction.
What to Look For:
- Dots Below Price: When the SAR dots are below the price, it suggests an uptrend.
- Dots Above Price: When the SAR dots are above the price, it suggests a downtrend.
- Dot Flip (Reversal Signal):
- When the price crosses above the SAR dots, it can signal a potential bullish reversal.
- When the price crosses below the SAR dots, it can signal a potential bearish reversal.
- Acceleration Factor: The SAR dots move closer to the price as the trend continues, and the acceleration factor increases. This means the potential stop-loss levels tighten.
- Use as Trailing Stop: Traders often use the SAR dots as dynamic trailing stop-loss levels to protect profits.
- Sensitivity: The sensitivity of the SAR can be adjusted by changing the acceleration factor and the maximum acceleration factor. Higher values make the SAR more sensitive to price changes, potentially leading to more frequent signals (and potentially more false signals).

There’s a brutal truth most traders learn the hard way:
You can have the perfect setup… and still sabotage the trade.
Not because your strategy’s broken.But because your mind is.
Today we spotlight Jared Tendler, an internationally recognized mental game coach.

His philosophy has proved to be useful to traders.
Let’s go through some of them.
Jared Tendler teaches what most traders ignore until it’s too late:
It’s not just about controlling - about understanding the system behind them.
Tilt?
Doesn’t just “happen.”
It builds. Quietly. Predictably.
And unless you map it - track it like you would price action - it’ll wreck your trades before you even realize what hit you.
Here’s the core of his philosophy:
- You don’t eliminate emotion - you eliminate its chaos.
- You study your patterns like you study the market.
- And you create a process for handling pressure, not just hoping you’ll stay calm.
He breaks it down like a pro:
- Identify your tells. (Do you click more when nervous? Get quiet? Get greedy?)
- Dig up the cause. (Fear of being wrong? Needing to win to feel confident?)
- Build correction patterns. (Pre-trade routines. In-trade checks. Post-trade reviews.)
Because success isn’t about having zero fear or zero frustration.
It’s about knowing exactly what to do when it shows up.
If you’re spiraling, stalling, or second-guessing at the worst possible times - it’s not your strategy that needs fixing.
It’s your mental game.
Get your head right, and the trades follow.