
US-Iran Panic Markets
....................................................................................................................


Good morning - markets are messy, let’s break it down real simple.
Stocks? Trying to bounce - S&P, Nasdaq, Dow creeping back in the green after those US strikes on Iran rattled everyone.
Oil? Spiked big, now cooling off a bit.
But crypto? Brutal. Bitcoin crashed hard, a lot of traders got smoked, $400 million liquidations gone like that.
So here’s the play — stocks are recovering for now, oil’s still jumpy, and crypto’s bleeding.
Big headlines still flying, market’s still shaky.
Stay sharp — we’ve got the crucial updates you need to trade smart today.
Let’s get to work.

💣 US Strikes Shake Markets
U.S. strikes on Iran's nuclear sites send oil soaring 2% and U.S. stock futures tumbling — all eyes now on whether Iran closes the Strait of Hormuz.
🚗 Tesla’s Robotaxi Golden Age
Tesla’s geofenced robotaxi rollout in Austin sparks a “golden age” bullish wave — but with shares down ~21% YTD, is it hype or horizon-shifting?
⚠️ Black Swan off the Table
Analyst says U.S. strikes clipped Iran’s worst-case threat — no “black swan” shock yet. But markets aren’t popping yet — they’re holding tight.
💵 Dollar Firms on Fear
The U.S. dollar climbs as investors seek safety amid tension - even as markets wait for Iran’s next move.
₿ Bitcoin Tanks Hard, Below 100K
Bitcoin plunges below $100K, wiping out $450M in long positions — Iran war fears are ripping through crypto.
🪙 Gold Hits Gear, Eyes $4000
Gold surges toward $4,000 on waning war fears and U.S. deficits - is the end of the safe-haven rally near?
🛢️ Oil Spikes… Then Pauses
Oil jumps post-Iran strike then retreats as traders hold their breath — price action now hinges on Iran’s next step.

No New Trades Today — When the World Shakes, We Pause
With tensions flaring between the US and Iran, markets are jittery.
Headlines shift by the hour.
One tweet, one strike, and everything changes.
Volatility isn’t the same as opportunity - especially when it's driven by war drums.
So we hold back today.
Not out of fear.
But out of respect for the chaos.
When the dust settles, clarity returns.
And that’s when we strike.

You Don’t Need a 9-to-5 to Trade—You Need 15 Minutes and a Plan

If time is the enemy, strategy is the weapon.
Many aspiring traders think they need to be glued to their screens all day, but the truth is: smart trading isn’t about hours - it’s about intention. These trading newsletters are built for the busy.
They filter the noise, spotlight opportunities, and deliver bite-sized market insights you can act on quickly.
Whether you’ve got 15 minutes during lunch or a half-hour before work, you’ll know exactly what matters and how to make your move - no marathon sessions, no burnout.
If you’re tired of feeling like trading demands more time than you have, these newsletters will help you trade smarter - on your schedule.
👉Ready to begin - Start with these resources

Triple Exponential Moving Average (TEMA)
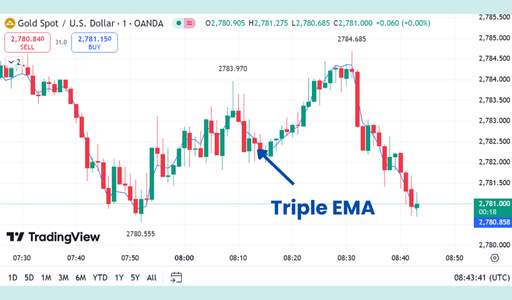
The Triple Exponential Moving Average (TEMA) is a technical indicator designed to provide a smoother and more responsive moving average compared to traditional EMAs, by reducing the lag inherent in most moving averages.
It achieves this by taking a single EMA, then a double EMA, and finally a triple EMA, combining them in a specific way to minimize delay.
What to Look For:
- Reduced Lag: TEMA is significantly faster and more responsive to price changes than a Simple Moving Average (SMA) or even a standard Exponential Moving Average (EMA) of the same period. This allows it to identify trend changes more quickly.
- Smoother Curve: Despite its responsiveness, TEMA also aims to provide a relatively smooth line, reducing the "noise" or minor fluctuations that can be seen in very fast-acting indicators.
- Trend Direction:
- Rising TEMA: Indicates an uptrend. The price is generally moving higher.
- Falling TEMA: Indicates a downtrend. The price is generally moving lower.
- Crossovers with Price:
- Price crossing above TEMA: Can be interpreted as a bullish signal, suggesting a potential uptrend or continuation.
- Price crossing below TEMA: Can be interpreted as a bearish signal, suggesting a potential downtrend or continuation.
- Crossovers with Other Indicators/TEMAs: While its primary use is as a standalone trend filter, multiple TEMA lines with different periods can be used for crossover strategies (e.g., a short-period TEMA crossing a longer-period TEMA).
- Dynamic Support and Resistance: TEMA can act as a dynamic support level in an uptrend (price finds support near it) and dynamic resistance in a downtrend (price encounters resistance near it).
- Confirmation Tool: TEMA is often used as a confirmation tool for other trading signals, providing an additional layer of evidence for trend strength or reversal.

Monday Truths Only

You can fake confidence on Instagram.
You can fake lifestyle for your friends.
But you can’t fake progress in the market. 🎯
It’s Monday—the scoreboard’s real.
If your results aren’t adding up, face it.
Stop pretending your strategy’s solid if your account says otherwise.
Stop hiding losses like they’ll magically turn green.
In this game, silence is expensive.
You evolve… or the market expires your account. No middle ground.
Ask questions. Get help. Sharpen your edge.
It’s a new week. Face the chart. Face the truth. Level up. 💥


