
TSMC Sales Pop 26%
....................................................................................................................


Good morning - Monday’s pulse check is live.
Ethereum just pierced $4,000 for the first time in 2025, climbing above $4,300 amid strong macro tailwinds.
Bitcoin added another 3.6%, inching close to its July record high as crypto finds fresh demand - thanks largely to that new 401(k) rule that just opened floodgates for retirement capital.
Markets beyond crypto aren’t sitting still either.
Asian equities are edging up, with Japan’s Nikkei futures trading near record levels, while everyone’s watching the U.S. inflation report drop on Tuesday.
Powell’s next move and whether Fed easing gets back on the table could shake bonds, stocks, and currencies alike.
This week’s got teeth. From crypto breakouts to macro crosswinds, positioning matters more than ever.

⏫ Block Breakout, Jumps 8%
Cash App profit surges 16%, Square holds steady, and Wall Street rewards the beat with a big after-hours bid.
🏋 AI Chips Lift TSMC
July sales rip +26% as Nvidia & AMD orders keep fabs running full tilt. Record highs in sight.
🧈 New York Gold Futures Outrun Spot Gold
Trump tariff twist jolts futures premium, freezing Asia shipments and reviving fears of supply crunch.
📉 Copper Pops on Codelco Crash
Mine collapse at El Teniente tightens supply—weekly gain locked in as traders price in green-metal squeeze.
🔔 Ethereum Signals 200%-500% Altcoin Pump
Van de Poppe says a 200–500% moonshot is on deck by October as ETH/BTC rips 38% in a month. Risk-on is back.
🪙 Gold Smashes $3,500
Gold blasts past $3.5K for the first time ever, outpacing equities while traders juggle tariffs, Fed chatter, and dollar swings.
🛢️ Oil Holds $66 as Tariff Tensions Build
Crude steadies after a six-day slide while traders watch Trump–Putin moves and India sanctions ripple through flows.

Microchip Technology Inc. (NASDAQ: MCHP) - TP Hit!
That’s a wrap. 🎯
Price sliced right through our target zone.
Delivering an 8.08% gains before leverage.
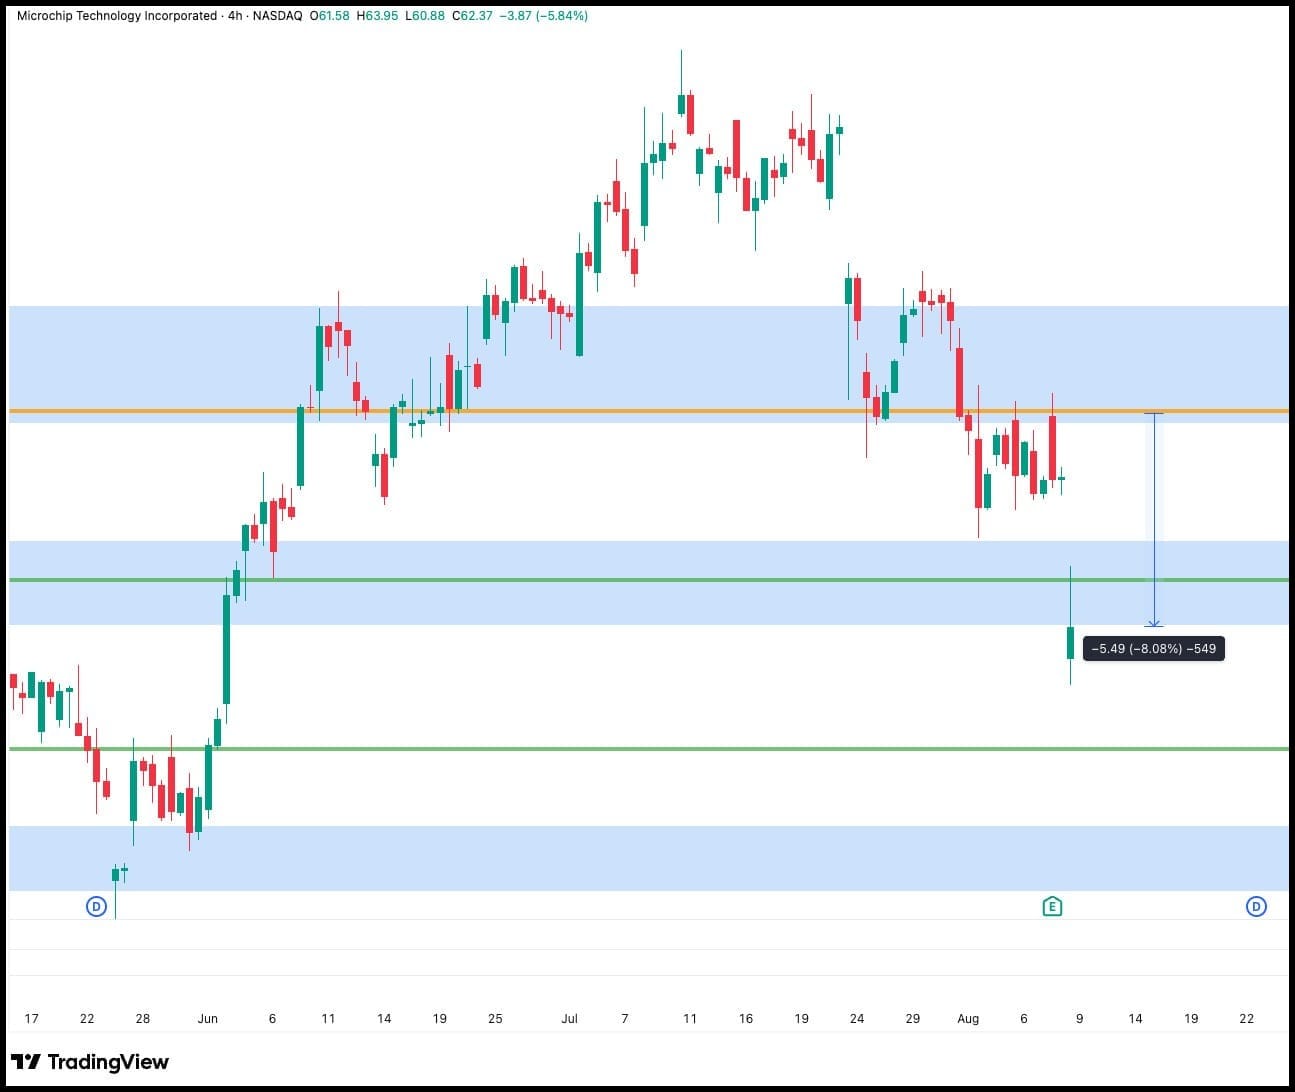
A clean drop from the AV SNR zone straight into our profit pocket.
When the setup is this clear, all we do is follow the plan…
And let the market do the heavy lifting.
Another one in the books. ✅
Recommendation: Cognizant Technology Solutions (NASDAQ: CTSH)
After weeks of drifting in a tight range.
CTSH has finally given us the break we’ve been waiting for.
Price has pushed up from a strong AV SNR support zone, showing buyers are quietly stepping in.
This is the kind of base-building that often fuels the next leg higher.
We’re stepping in for a buy at $69.58.
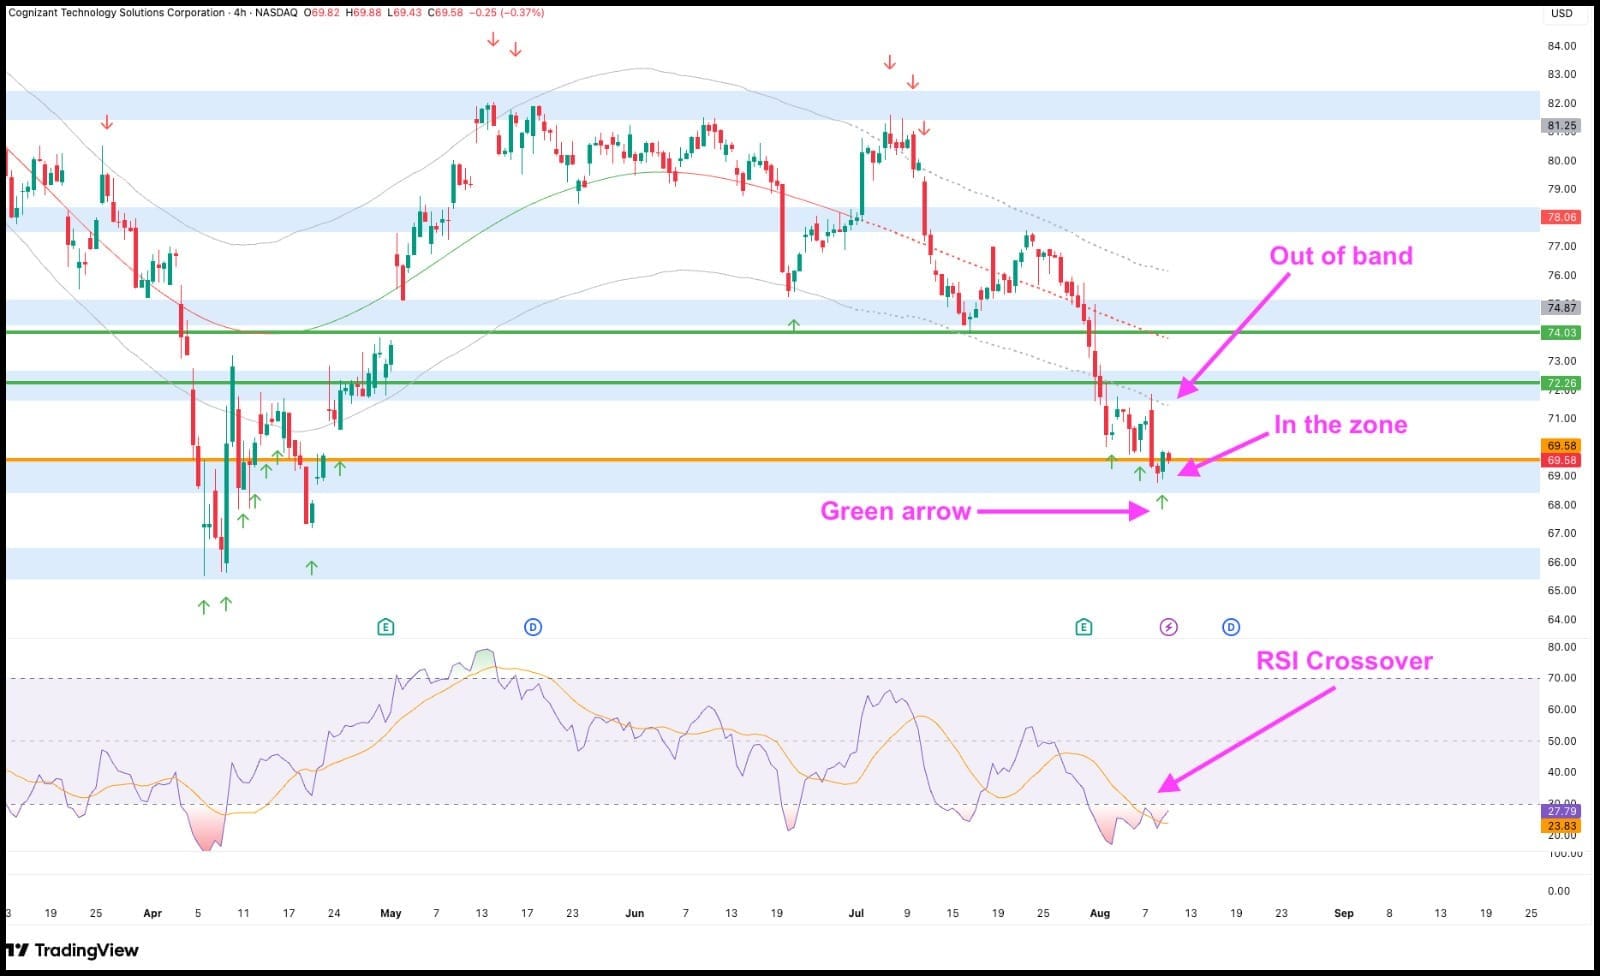
🎯 Targets:
Buy: $69.58
TP1: $72.26
TP2: $74.03
It’s like catching the train just as the doors close…
And watching it pull away toward our station. 🚆
Update you soon!

The “One Big Trade” Lie That’s Keeping You Broke

If you’re still hunting for that one massive trade that’s going to “change everything”… you’ve been sold a dream and it’s draining your account.
Movies and social media love the overnight success story: the rookie trader who “bets it all” and walks away rich.
But in the real market?
That’s just gambling with extra steps.
Chasing that fantasy keeps you stuck in a cycle of hype, over-leverage, and heartbreak.
Pro traders know something most don’t: wealth comes from stacking small, consistent wins, not swinging for the fences.
It’s boring. It’s methodical. And it works.
When you ditch the “one big trade” mindset and focus on steady growth, you stop bleeding money on risky plays and start building a track record you can trust.
The truth?
The market rewards patience, discipline, and repetition not drama. So stop waiting for that miracle breakout.
Create your own by showing up every day and letting small gains do the heavy lifting.
👉 Get trading strategies that work without gambling it all.

Dragonfly Doji

The Dragonfly Doji is a single-candlestick bullish reversal pattern that appears during a downtrend.
It signals that sellers were rejected at a low point, and buyers may be starting to take control, hinting at a potential bottom.
What to Look For
- Long Lower Shadow: This is the most crucial feature. The candlestick has a long "tail" extending downwards. It shows that sellers pushed prices much lower, but buyers strongly pushed them all the way back up to the open price before the close.
- Little or No Real Body: The open and close prices are at or near the high of the session, creating a very small or non-existent body. It looks like the letter "T" with a long lower shadow and no upper shadow.
- Appearance After a Downtrend: For the Dragonfly Doji to be a valid reversal signal, it must form after a clear period of falling prices. It suggests the downtrend might be exhausted.
- Psychology: It represents sellers attempting to drive the price down, but strong buying interest emerges and pushes the price all the way back up to the opening level. This is a very strong signal that buyers are becoming active and potentially overwhelming the sellers.
- Confirmation is Crucial: The Dragonfly Doji is a strong warning sign, but not a guaranteed reversal on its own. Confirmation from the next candle (e.g., a strong bullish candle, a gap up, or a close above the Doji's high) is essential to validate the bullish signal.
- Visual Similarity to Gravestone Doji: It looks exactly opposite to the Gravestone Doji, which has a long upper shadow and appears at the top of an uptrend.

The Man Who Charted His Way to Millions

Thomas Bulkowski didn’t start as a Wall Street hotshot.
He was just an engineer with a fascination for price charts and a knack for spotting patterns no one else paid much attention to.
In the 1980s, while most traders were chasing “hot tips,” Bulkowski quietly began studying chart behavior in obsessive detail.
He tracked thousands of stock movements, cataloged patterns, and tested them against real market data.
Over time, his private database became one of the most comprehensive pattern studies in trading history.
By his mid-30s, he had saved and invested enough to retire - financially independent purely through disciplined trading and investing.
Bulkowski didn’t stop there.
He turned his findings into a series of books, like Encyclopedia of Chart Patterns, that traders worldwide now treat as reference bibles.
The Lesson: Markets reward data-driven discipline.
Bulkowski didn’t guess - he measured.
He didn’t chase hype - he tracked probabilities.
In an age where traders can get lost in noise, his career is a reminder that the clearest edge is knowing, not hoping.
What We Now Know
- Bulkowski’s trades were based on verified statistical edges, not emotion.
- He built one of the largest personal databases of chart patterns in existence.
- Achieved financial independence by his mid-30s—then kept contributing to the trading community.
- His research shows patterns have measurable probabilities of success and failure.
- His work proves that trading is less about prediction and more about preparation.
💡 Monday Takeaway: The market isn’t a casino if you treat it like a science lab. Track, test, and trust your data - the edge is in the evidence.


