TSMC Revenue Jumps 35%
....................................................................................................................


Good morning.
The market’s winning streak just hit a wall of reality.
After seven straight days of "ceasefire euphoria," the momentum is finally stalling out this Friday. We’re seeing a sea of cautious red - Nasdaq and S&P futures are down 0.1%, while the Dow is slipping 0.2%.
It turns out that a two-week pause in fighting is a lot easier to announce than it is to actually manage.
The Strait of Hormuz is becoming an expensive parking lot. Just as we thought the "supply heart attack" was over, Tehran slammed the gates shut again, accusing Israel of breaching the truce.
To make matters worse, they’re now planning to "toll" any tanker that tries to pass through, which prompted a fresh round of threats from the White House. While the oil pits aren't panicking yet, the "reopening" narrative is looking a lot more complicated than investors hoped.
Peace talks are the main event this weekend. Senior U.S. officials are leaning hard on Netanyahu to scale back strikes in Lebanon, but the official word from Israel is blunt: "There is no ceasefire in Lebanon."
All eyes are on the diplomatic teams meeting this weekend to see if this "shaky pause" can turn into something permanent—or if we’re just counting down the days until the missiles fly again.
But don't forget the "Inflation Monster" under the bed. While we watch the Middle East, the March CPI report is looming. Economists are bracing for a 0.9% jump month-over-month, which would put yearly inflation at 3.3%.
If those numbers come in hot, the Fed’s "rate cut" hopes might stay frozen regardless of what happens in the Strait.
It’s a "hold your breath" Friday.
The rally was fun while it lasted, but with the weekend talks on deck and inflation data around the corner, nobody wants to be the last one holding the bag.

🥇 Gold Heads for Weekly Gain as Vance Leads Truce Talks
Bullion steadied near $4,765 an ounce Friday, on track for a 2% weekly gain as investors look toward high-stakes negotiations in Islamabad. A U.S. delegation led by VP JD Vance is set to meet Iranian officials this weekend, though unresolved geopolitical tensions and upcoming U.S. inflation data are keeping safe-haven demand high.
📊 Stocks Shaky as Lebanon Attacks Test Fragile Ceasefire
Global markets turned volatile Friday as Iran warned that ongoing Israeli strikes in Lebanon could derail the two-week truce with the U.S. Traders are questioning the durability of the ceasefire, with Fed funds futures now shifting focus to April 2027 for any potential monetary easing.
📉 Palantir Plunges 7% After Michael Burry Critique
Shares of Palantir (PLTR) sank after "Big Short" investor Michael Burry claimed AI startup Anthropic is "eating Palantir's lunch." Despite Burry later deleting the blunt post on X, the commentary sparked a sharp sell-off as investors reassess Palantir’s competitive moat in the rapidly evolving AI landscape.
🛢️ Oil Rises on Saudi Supply Cuts Despite Weekly Slump
Brent climbed above $96 a barrel after Saudi Arabia reported reduced production capacity following infrastructure attacks. Despite the two-day bounce, crude is still on track for its worst weekly loss since June as the U.S.-Iran ceasefire continues to pull prices down from recent peaks.
🚗 Tesla Faces 8th Weekly Slide Despite Cheap SUV Plans
TSLA stock is staring down its eighth consecutive week of losses following a disappointing Q1 delivery report that triggered a wave of analyst price-target cuts. Reports that Tesla is pivotting back to its EV roots with a smaller, affordable SUV have so far failed to reverse the downward momentum.
📈 TSMC Revenue Surges 35% to Record High on AI Boom
Taiwan Semiconductor (TSMC) posted record Q1 revenue of $35.6 billion, a massive 35% year-on-year jump fueled by relentless demand from Nvidia and Apple. The results solidify TSMC’s role as the primary beneficiary of the AI infrastructure race ahead of next week's ASML earnings.
🌏 Asia Markets Rise Despite Hormuz Traffic Restrictions
Asia-Pacific indices mostly gained Friday, though sentiment remains fragile as the Strait of Hormuz stays largely restricted despite the ceasefire. Investors remain on tenterhooks as the Middle East conflict enters its second month, keeping regional energy costs and trade routes under severe pressure.

When You’re Tired, Your Trading Shows It
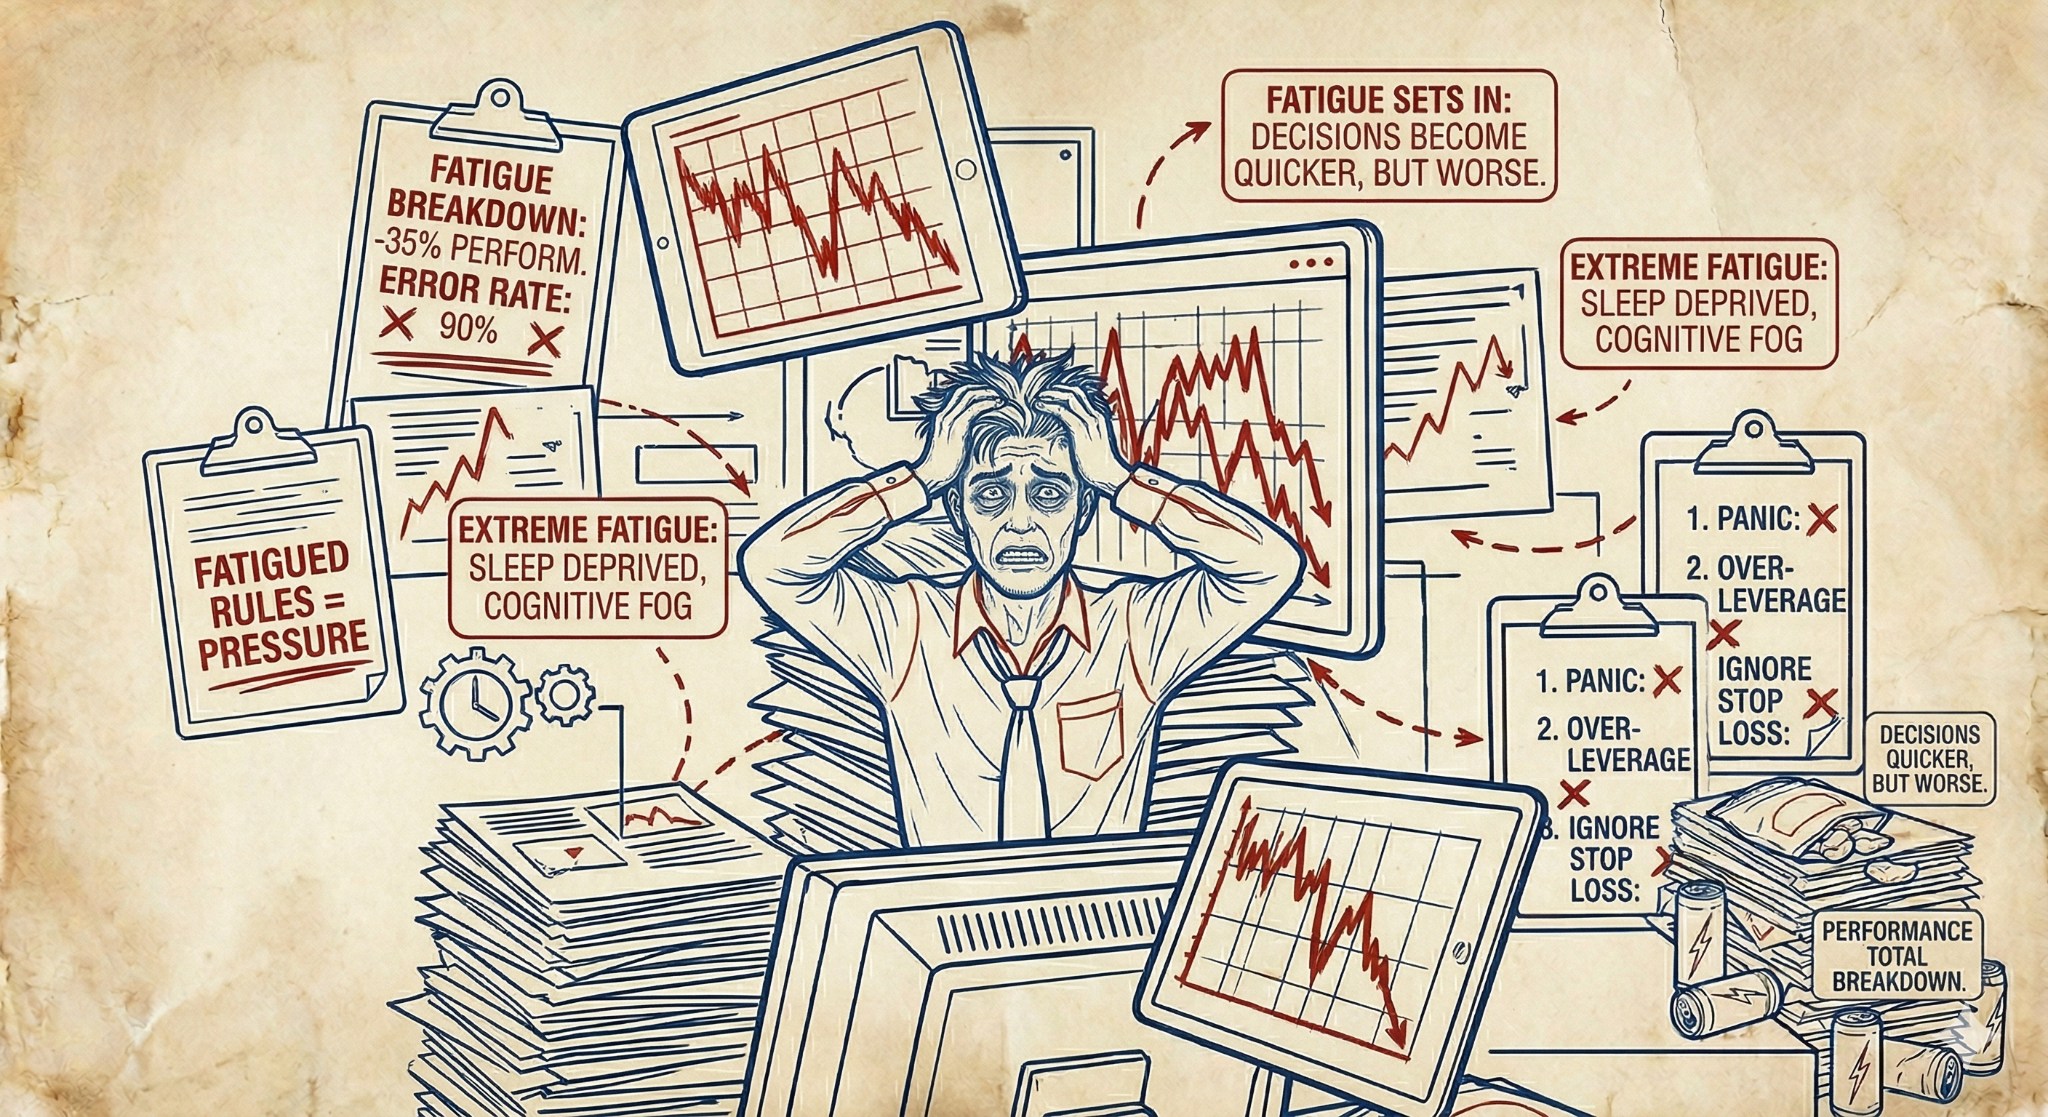
You stay on the charts longer. One more setup. One more move. The market never really closes, so neither do you.
At first, it feels like dedication.
Then fatigue sets in.
Focus drops. Patience fades. You start forcing trades just to stay active. Small mistakes slip in. Decisions become quicker, but worse.
That’s where performance breaks down.
More screen time does not mean better trading. Without rest, your edge weakens. What you see on the chart becomes less clear, and what you execute becomes less precise.
Strong traders know when to step away. They set limits. They protect their energy the same way they protect their capital.
Because a clear mind makes better decisions.
When you manage your time and rest properly, your trading sharpens. You act with intention instead of impulse.
Recovery improves execution.
Some traders like exploring how others structure their routines and approach the markets with clarity.
If that’s you, you can discover a few different perspectives here:

Vortex Indicator
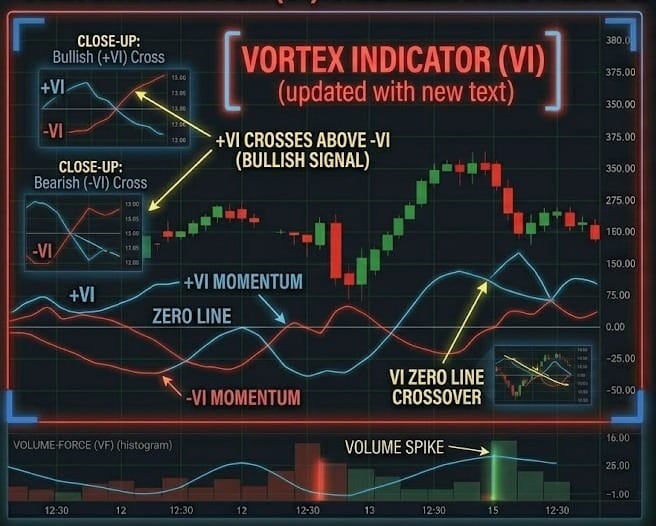
The Vortex Indicator consists of two lines: the VI+ (Positive Trend) and the VI- (Negative Trend). It is inspired by the movement of water (vortices) and measures the connection between high, low, and closing prices over time. Its primary goal is to identify the start of a new trend and confirm its strength by measuring the "distance" between price extremes.
🛠️ The Strategy Logic
Use these logical triggers to spot the birth of a trend and avoid being trapped in sideways price action:
- IF: The VI+ (Positive) line crosses above the VI- (Negative) line...
- THEN: A bullish trend has been triggered. This indicates that the upward "vortex" is becoming stronger than the downward force, signaling a high-probability "Buy" entry.
- THEN: A bullish trend has been triggered. This indicates that the upward "vortex" is becoming stronger than the downward force, signaling a high-probability "Buy" entry.
- IF: The VI- (Negative) line crosses above the VI+ (Positive) line...
- THEN: A bearish trend is now in control. The selling pressure has overtaken the buying demand, signaling a "Sell" or a short entry.
- THEN: A bearish trend is now in control. The selling pressure has overtaken the buying demand, signaling a "Sell" or a short entry.
- IF: Both the VI+ and VI- lines are moving away from each other (expanding the gap)...
- THEN: The current trend is gaining Velocity. This confirms a strong, healthy move. As long as the gap is widening, you should stay in the trade and ignore minor pullbacks.
- THEN: The current trend is gaining Velocity. This confirms a strong, healthy move. As long as the gap is widening, you should stay in the trade and ignore minor pullbacks.
- IF: Both lines start moving toward each other and "twining" or crossing frequently...
- THEN: The market has entered a Congestion Zone. The trend has died, and the market is moving sideways. This is a signal to stay on the sidelines and wait for a clear "breakout" crossover.
- THEN: The market has entered a Congestion Zone. The trend has died, and the market is moving sideways. This is a signal to stay on the sidelines and wait for a clear "breakout" crossover.
- IF: The VI+ reaches an extreme level (like 1.5) and begins to curve back...
- THEN: The trend is Overextended. While the trend is still technically bullish, the "stretch" is at a maximum, suggesting a period of profit-taking or a mean-reversion is imminent.
💡 Pro Tip
The "Extreme Cross" Secret: The most powerful signals occur when the crossover happens at the extremes of the indicator range (very high or very low). If VI+ crosses VI- while they are both very far apart, the momentum shift is often explosive.
To filter out false signals, pair the Vortex with the 14-period ADX. Only take Vortex crossovers when the ADX is above 20, ensuring that you are only entering when there is actually a trend worth following.

You Already Decided the Trade
Be honest.
Before the entry… before the confirmation… before the “analysis”…
You already knew what you wanted to do.
Long or short - the decision was made early.
Everything that came after?
Just you trying to feel right about it.
THIS ISN’T ANALYSIS.IT’S JUSTIFICATION.
You open more charts.Flip through timeframes.Scroll through opinions.
But notice the pattern:
You pause on anything that agrees.You ignore anything that challenges you.
Suddenly your idea feels stronger.
Not because it’s better.
Because it’s been reinforced.
YOU’RE NOT TESTING THE TRADE.YOU’RE DEFENDING IT.
That’s where objectivity disappears.
Because real analysis is uncomfortable.
It asks:
- Where am I wrong?
- What invalidates this idea?
- What am I missing?
But once you’re emotionally attached?
You stop asking those questions.
You protect the bias.
And that’s how traders walk into weak setups with full confidence.
Then price moves against them…
And confusion hits.
“How did I miss that?”
You didn’t miss it.
You filtered it out.
Professionals don’t build trades this way.
They don’t start with a conclusion.
They start with conditions.
If price does this → I act.If it doesn’t → I wait.
No bias. No attachment. No need to be right.
Because in trading, being right is irrelevant.
EXECUTING CORRECTLY IS EVERYTHING.
So here’s the shift:
Before you enter any trade, stop and ask:
“If I had no opinion right now… would I still take this?”
If the answer is no…
You’re not trading the market.
You’re trading your need to be right.