Trump Elon Fight Dirty
....................................................................................................................


Good morning!
It’s Monday — time to shake off the weekend and face the beast.
The S&P is less than 2% from an all-time high. The Nasdaq’s charging ahead. Job numbers look solid.
And this week? A fresh inflation print could either pour fuel on the rally... or kill the vibe entirely.
Wall Street’s already moving — question is, are you? Because if you’re not making money, you better be making progress. The market doesn’t hit pause.
New data. New setups. New chances to level up.Study the market. Study yourself. Sharpen the blade.
Let’s get to work. 💥

📈 Markets Rebound After Musk-Trump Feud
Stock futures surged 0.4% as Musk and Trump hinted at a truce. After fiery threats and NASA tension, peace talks are in motion. Is this a fragile calm before another political storm?
🧨 Trump Torches Elon’s Billions
Musk called for impeachment. Trump fired back with fury and threats. Now Elon’s $27B poorer, and Republicans are walking away. Can Musk recover—or is his political clout toast?
☎️ Tesla Jumps as Trump Cools Off
White House aides stepped in to calm the chaos—and investors cheered. After Musk called for impeachment and Trump threatened contracts, détente is in the air. Temporary truce or lasting peace?
💣 $1B Gone in 24H—Thanks, Trump & Elon
Bitcoin, ETH, DOGE, TRUMP—all down bad as Musk and Trump rip each other apart online. Markets tanked while insults flew.
🔑 $112K Bitcoin? Fed Holds the Key
Traders are watching for early rate cuts that could send BTC surging. The jobs report and Trump’s tariffs are wildcards in play. Will macro chaos drive a Bitcoin boom?
👀 Oil’s Boring Bounce? Don’t Blink
Volatility has vanished and prices are glued to $65. But analysts warn a post-summer slump could hit hard. Is the market sleepwalking into a crash?
🚀 Silver Pops to 13-Year High
Silver and platinum are suddenly stealing gold’s thunder. Spot silver hit $36.22 after a 4% surge, driven by industrial demand and ETF inflows. Is this the start of a full-blown precious metals bull run?

Quick Update – Still in Motion
No new trades today.
Still holding DexCom Inc. (NASDAQ: DXCM) as planned.
And for Murphy USA Inc. (NYSE: MUSA)
I’ve added another layer at $424.97, bringing our breakeven to $438.
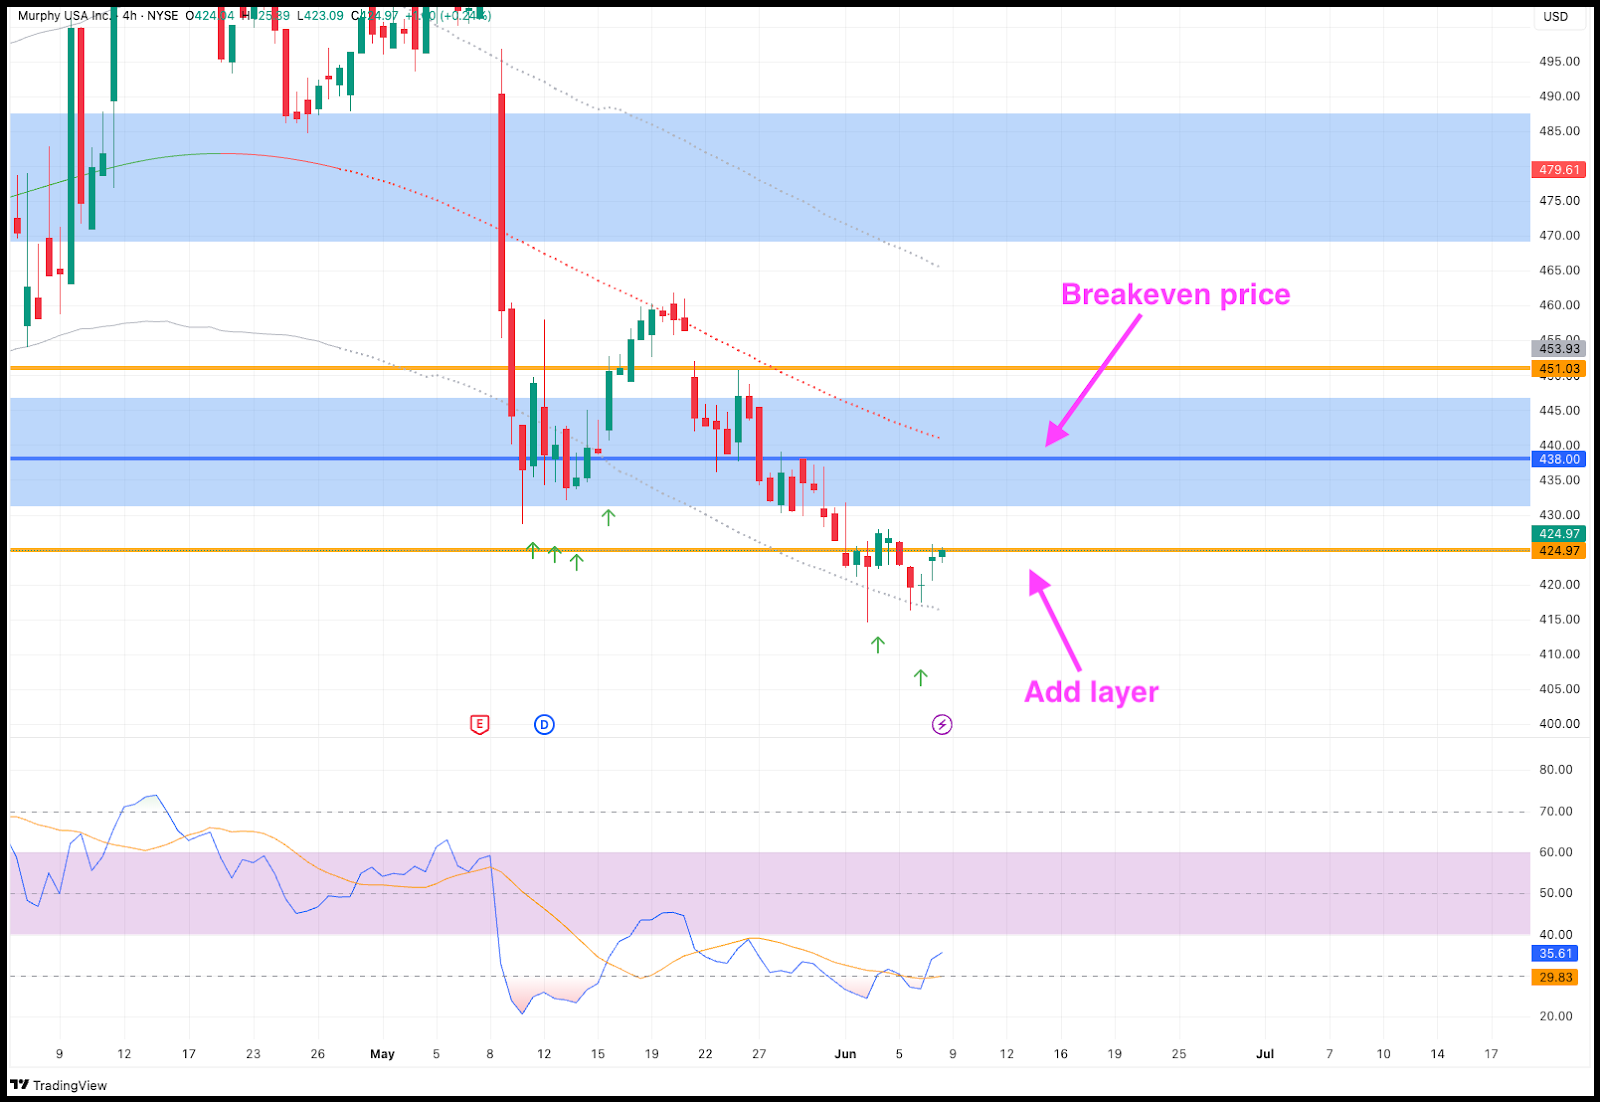
That's what we will aim for.
Now it’s all about patience and precision.
More updates coming as the move develops. 👀📊

Confused by Conflicting Strategies? Your Brain Deserves Better.

One trader says buy the dip. Another says wait for confirmation.
Meanwhile, your chart looks like a crime scene.
When you're new - or even seasoned - too many voices can paralyze your decision-making.
The fear of choosing the wrong mentor, the wrong strategy, or the wrong approach leaves you stuck in a loop of analysis paralysis.
That’s where these trading newsletters come in.
They're not a grab bag of random tips - they’re a curated stream of trustworthy insights from experienced traders with skin in the game.
Instead of bouncing between contradictory YouTube videos, you'll get practical guidance from consistent voices, helping you build a solid, repeatable system you can trust.
👉 If you're tired of guessing your way through trading, these newsletters will give you the guidance you need to move forward with confidence:
Get the clarity you need here.

Donchian Channels

Donchian Channels are a technical indicator that displays the highest high and lowest low over a specified number of past periods.
They form a "channel" around the price, helping to identify trends, breakouts, and potential support/resistance levels.
What to Look For:
- Three Bands:
- Upper Band: Represents the highest price reached over the defined period (e.g., last 20 days).
- Lower Band: Represents the lowest price reached over the defined period.
- Middle Band: The average of the upper and lower bands.
- Trend Identification:
- Uptrend: Price consistently trading near or touching the upper band indicates a strong uptrend.
- Downtrend: Price consistently trading near or touching the lower band indicates a strong downtrend.
- Breakout Signals:
- Break above Upper Band: Can signal a potential buying opportunity, suggesting the price might continue to rise (new high).
- Break below Lower Band: Can signal a potential selling or shorting opportunity, suggesting the price might continue to fall (new low).
- Support and Resistance: The upper and lower bands act as dynamic support and resistance levels.
- Volatility Measure: The width of the channel indicates volatility. A wider channel suggests higher volatility, while a narrower channel suggests lower volatility.
- Stop-Loss and Exit Points: Traders often use the channels to set stop-loss orders (e.g., placing a stop-loss just below the lower band for a long position).
- Period Length: The default period (often 20) can be adjusted. Shorter periods make the channels more sensitive for short-term trading, while longer periods smooth out data for long-term trend following.

Let’s be real…
It’s already June, and for some people, nothing’s changed.
Still stuck. Still confused. Still lying to themselves.
Here’s one thing I’ve learned the hard way:
Self-deceit is a silent killer.
You keep telling yourself “I’ll get serious next week.” Then boom — the year’s gone and so is your chance.
Let me give you this advice — from me to you:
Own this year or lose it.‼️
If you’re lost, seek direction.
If you’re lacking, find who’s got the light.
If you’re in confusion daily, that’s your sign to slow down and seek counsel.
No one is born for success.
But if you walk with 3 people who are, it rubs off fast.
Growth is contagious — if you’re around the right energy.
So take inventory of your circle.
Take responsibility for your mindset.
And above all… tell yourself the TRUTH.
Even when it hurts.
ESPECIALLY when it hurts.
Because the longer you lie to yourself,
The harder it gets to find your way back.