Trump 15%Tariff Blowout
....................................................................................................................


Good morning, traders.
Grab your coffee because the tape is looking messy this Monday.
We’re seeing a sea of red as the market grapples with a massive curveball from the Supreme Court, which just shot down President Trump’s broad tariff plans.
While less trade tension sounds like a win, the uncertainty is killing the vibe. Trump’s weekend response, vowing to hike baseline tariffs to 15% immediately has futures sliding, with the tech-heavy Nasdaq leading the drop at 0.7%.
It’s not just trade wars, either.
We’ve got a high-stakes showdown with Iran on deck.
Oil is cooling off slightly today as everyone waits to see if those nuclear talks actually produce a deal or lead to more fireworks.
Between the tariff drama and the geopolitical heat, it's a "Risk-Off" start to the week.
Stay light on your feet and keep your stops tight- we’ve got Nvidia earnings on Wednesday that could make or break this AI rally.

💥 Tariff Shock Hits Stocks, Crypto Stays Calm
Donald Trump raised global tariffs to 15%, rattling equities worldwide. Surprisingly, crypto markets barely flinched despite the trade shock.
🔄 Money Rotates Out of Tech
Investors are ditching megacap tech and chasing sectors playing catch-up. The AI scare trade is reshaping winners across Wall Street.
📉 Bitcoin Slips Below $65K
Tariff uncertainty pushed Bitcoin below $65,000 again this month. Traders remain nervous as macro headlines shake confidence.
🏦 Treasury Yields Stay Steady
Bond markets held firm as investors weighed new tariffs from Donald Trump. Markets are waiting for clearer signals before making big moves.
💸 XRP Logs $1.9B in Losses
XRP saw its biggest realized losses since 2022. On-chain data shows traders locking in heavy pain amid volatility.
😱 Bitcoin Fear Returns
Bitcoin wiped weekend gains as fear gauges hit historic lows again. Panic selling shows how fragile sentiment still is.
🛢️Oil Drops on Iran Deal Hopes
Crude slipped as traders weighed progress toward a nuclear deal with Iran. Markets are balancing geopolitical risk against supply outlook.

If It’s Not Clear, It’s No Trade
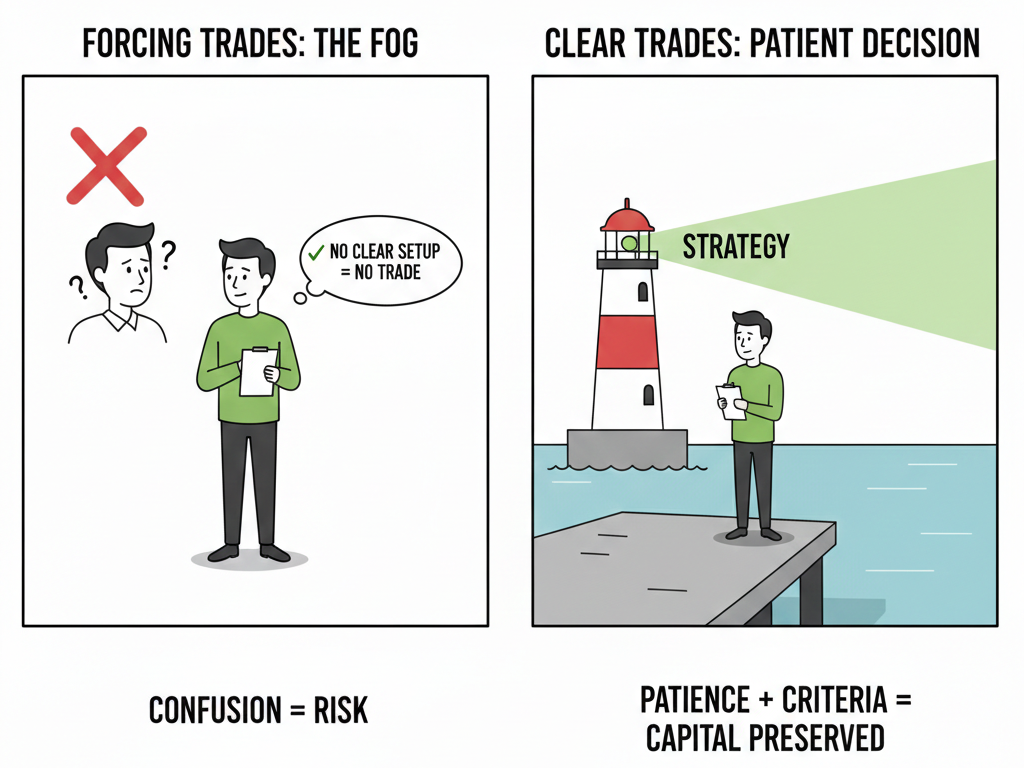
Not every chart deserves your money. If you have to convince yourself to enter, it’s probably not the setup. Clear trades feel structured. Forced trades feel like hope.
This is where many traders lose consistency. They see something “almost” right. Almost the breakout. Almost the pullback. Almost the confirmation. So they enter anyway. That’s when small, unnecessary losses start stacking up.
Strong traders have clear no-trade rules. If the setup doesn’t match their plan, they sit out. No debate. No negotiation. They understand that protecting capital is part of the strategy.
When you decide in advance what not to trade, your decisions get cleaner. You stop chasing. You stop forcing action. You wait for alignment instead of guessing.
Clarity protects capital.
If you want trading guidance that helps you define clear setups and avoid unnecessary trades, these newsletters help. They focus on structure, patience, and disciplined execution instead of random activity.

Ease of Movement (EOM)
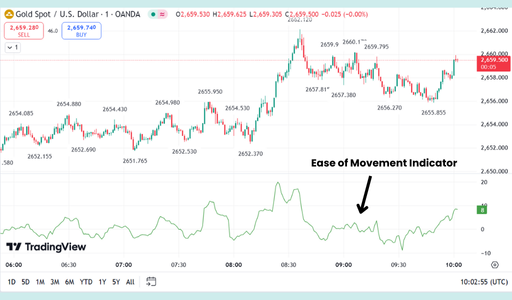
The Ease of Movement (EOM) is a momentum oscillator that looks at the relationship between price change and volume. It is designed to show how much "effort" is required to move the price. If price moves easily on low volume, the EOM will spike; if it takes massive volume to move the price only a small amount, the EOM stays near zero.
🛠️ The Strategy Logic
Use these logical triggers to identify high-conviction trends and spot when a market is "working too hard" to stay afloat:
- IF: The EOM line crosses above the zero line and rises sharply...
- THEN: The price is advancing with very little resistance. This indicates a "clean" uptrend where buyers are in total control and there is very little selling pressure blocking the path.
- THEN: The price is advancing with very little resistance. This indicates a "clean" uptrend where buyers are in total control and there is very little selling pressure blocking the path.
- IF: The price is hitting new highs, but the EOM is falling toward the zero line...
- THEN: The market is "struggling." It is taking more and more volume (effort) to push the price higher, which usually signals that a trend reversal or a major consolidation is coming soon.
- THEN: The market is "struggling." It is taking more and more volume (effort) to push the price higher, which usually signals that a trend reversal or a major consolidation is coming soon.
- IF: The EOM line crosses below the zero line...
- THEN: Selling pressure is dominating with ease. This suggests that even a small amount of selling is causing the price to drop significantly, confirming a bearish trend.
- IF: The EOM stays near the zero line while the price is moving...
- THEN: You are in a "Heavy Market." This indicates that there is a massive tug-of-war between buyers and sellers (high volume but little price movement). This is a signal to stay on the sidelines as the market is inefficient and "choppy."
- THEN: You are in a "Heavy Market." This indicates that there is a massive tug-of-war between buyers and sellers (high volume but little price movement). This is a signal to stay on the sidelines as the market is inefficient and "choppy."
- IF: The EOM shows a Bullish Divergence (Price makes a lower low, but EOM makes a higher low)...
- THEN: The "Force" of the sellers is dying out. It is becoming harder for them to push the price lower, which often precedes a massive V-shaped recovery.
💡 Pro Tip
The "Thin Market" Warning: Because EOM rewards price movement on low volume, it can sometimes give "false positives" in very thin or illiquid markets (like low-cap stocks or late-night forex). To fix this, always use a 14-period Moving Average on your EOM. Don't trade the raw, jagged line; only take signals when the smoothed EOM line confirms the move. This filters out the "freak" price jumps that aren't backed by a real trend.

The Screenshot Illusion

You open your phone.
Another trader posts a clean chart. Perfect entry. Perfect exit. Caption: “Light work.”
What you don’t see?
The full equity curve.
The drawdowns.
The chopped-up weeks.
The red days quietly deleted.
SOCIAL MEDIA SHOWS HIGHLIGHTS.
TRADING IS A FULL SEASON.
Comparison in trading is dangerous because it attacks your patience.
You start questioning your pace. Your system. Your progress. You were fine five minutes ago — until someone else’s win made you feel behind.
That distortion changes behavior.
You size up to “catch up.”
You take setups outside your plan.
You judge your skill by someone else’s cherry-picked moment.
Here’s the truth most won’t say:
If you traded someone else’s full history — not their best screenshot — you might not even want their strategy.
Serious traders track metrics, not moments.
Win rate. Risk-to-reward. Max drawdown. Execution consistency.
A screenshot is a moment.
An edge is a process.
Next time you feel that comparison sting, ask yourself:
Would I trade their full year — or just their best day?
Focus on building a curve you don’t need to crop.