
Tesla Shoots Up
....................................................................................................................


Good morning Traders,
Wall Street’s sitting on the edge of its seat.
The Fed is all but locked in for its first rate cut of 2025 this week, but the real drama isn’t Wednesday’s quarter-point trim - it’s what comes next.
The dot plot will drop right after the decision, and that’s where traders are looking for clues.
Does Powell stick to the June script of two cuts this year? Or does fresh weakness in jobs and Trump’s mounting pressure force the Fed to go deeper?
Stocks are already climbing into the meeting, with the S&P and Nasdaq hitting records on rate-cut bets.
But under the surface, the White House is poking at the central bank, labor data keeps flashing red, and sticky inflation hasn’t backed off.
This week isn’t just about one cut.
It’s about the path the Fed dares to take next.

📈 Wall Street Climbs Ahead of Fed
S&P and Nasdaq set fresh records as traders bet big on a coming rate cut.
🏦 Fed Cut Hits Your Wallet
A quarter-point trim’s coming—here’s what it means for your cash, cards, and credit.
🚗 Musk Drops $1B on Tesla, Stock Jumps
Elon scooped 2.57M shares—traders piled in, sending the stock up 8% premarket.
📊 Trump Wants Fewer Earnings
POTUS says ditch quarterlies for semiannuals - Wall Street calls it risky business.
⚡ Altcoins Outpace Bitcoin Bets
Alt OI nearly tops BTC’s, a setup that’s often spelled drawdowns in past cycles.
📉 Wearable Devices Stock (WLDS) Slides 25%
After a 570% moonshot, sellers dumped hard—retail now eyeing the $6 line.
🧈 Gold Correction Before $4K?
Analysts warn of a 5–6% dip before the next leg higher—bulls see it as a buy zone.

No new stock recommendations today.
All eyes are on the upcoming FOMC meeting .
And we know this event has the power to move the entire market.
Instead of jumping in too early, we wait.
Once the Fed’s decision is out and the market shows its hand, we’ll have cleaner, higher-probability setups to trade.
Patience first. Action after. 🎯

Trading Apps Don’t Bite. Don’t Fear Technology.
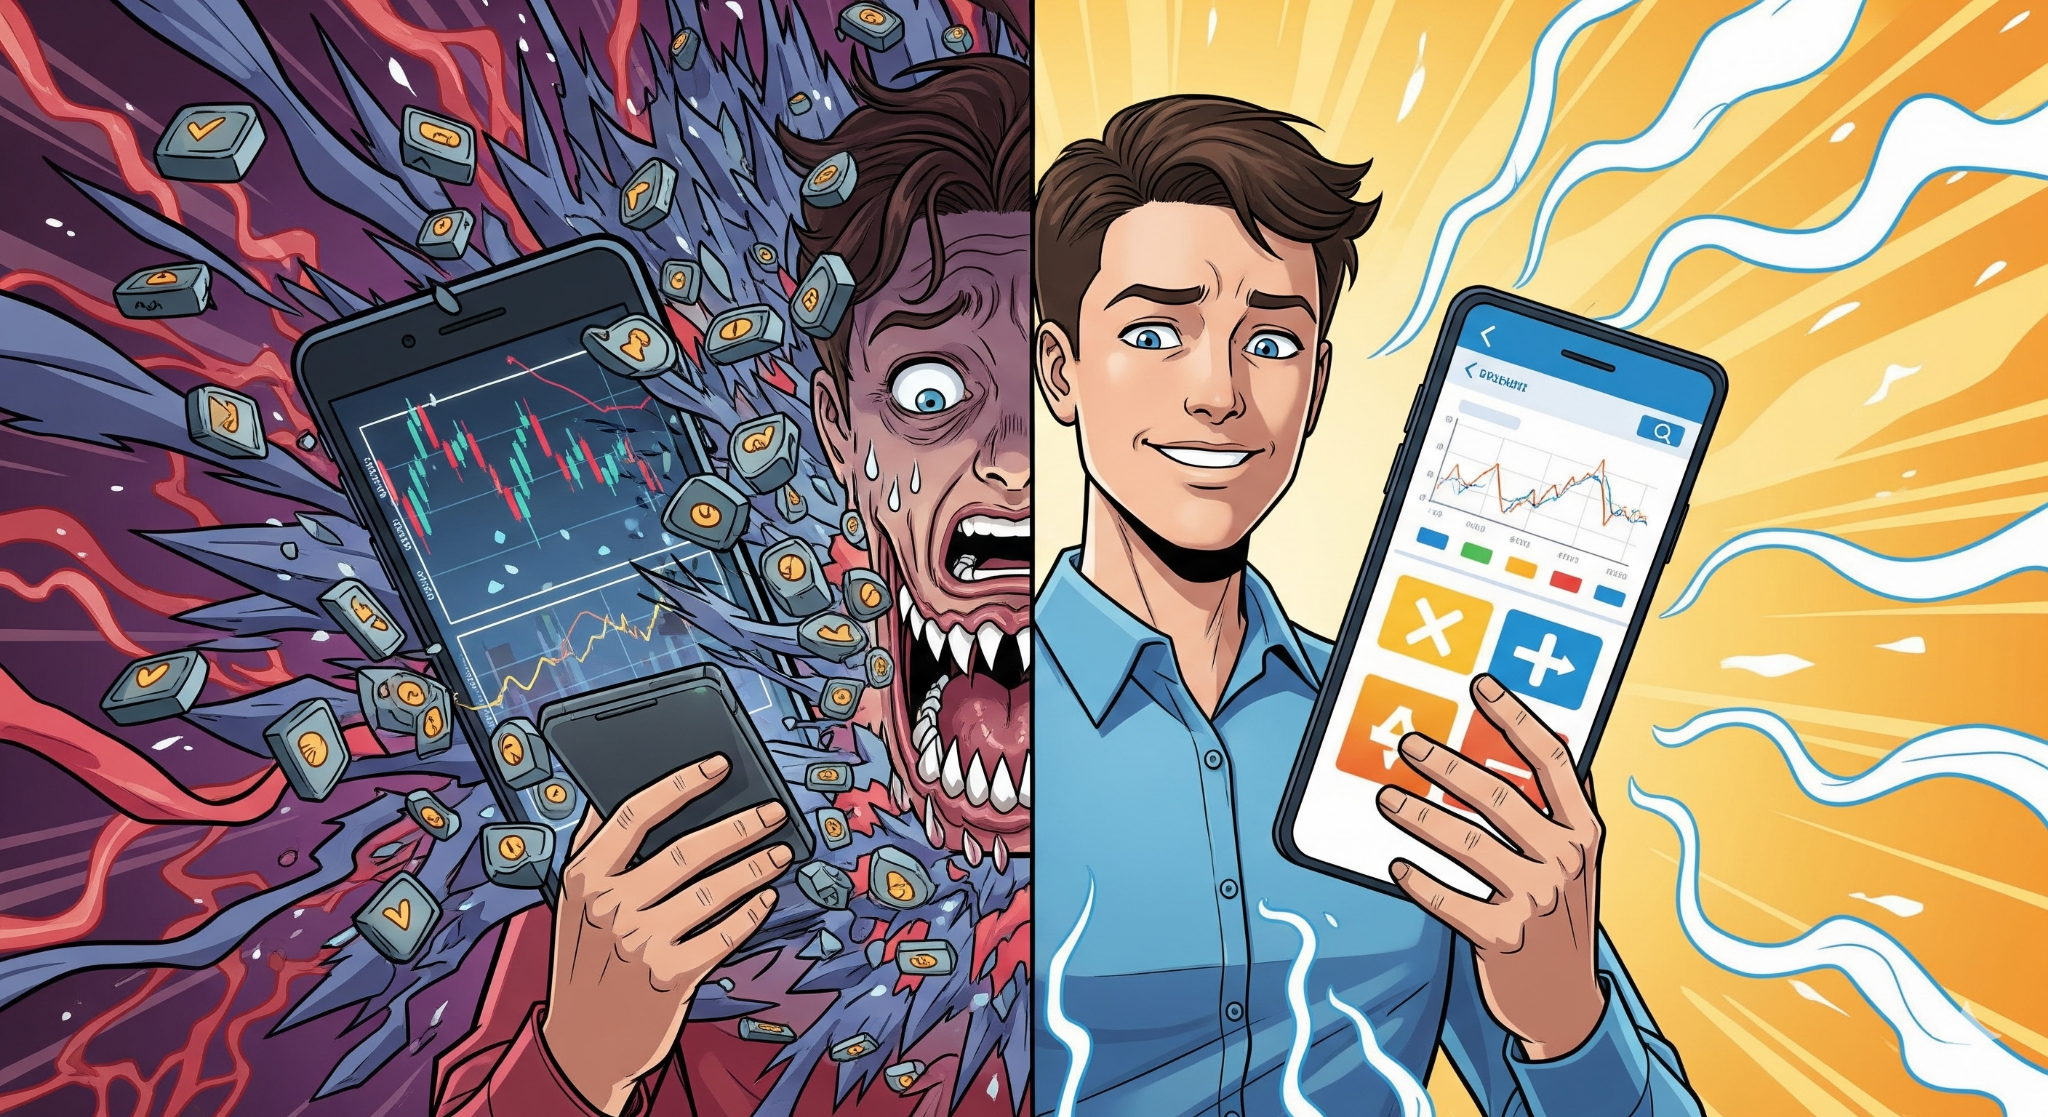
A lot of new traders freeze the moment they see a trading platform for the first time. Charts, buttons, tabs suddenly it feels like you need a manual just to log in.
That hesitation kills momentum before the first trade even happens.
The truth is, trading apps are designed to make your life easier, not harder. You don’t need to be a tech expert. The features that seem intimidating at first are just tools to help you track, manage, and execute trades.
Click around, learn step by step, and the confusion disappears fast.
Newsletters help too. They break down setups, highlight key actions, and guide you through platforms so you don’t feel lost.
They turn tech from a barrier into an advantage.
👉 Trading apps don’t bite. Start trading without fear here.

Bullish Kicker
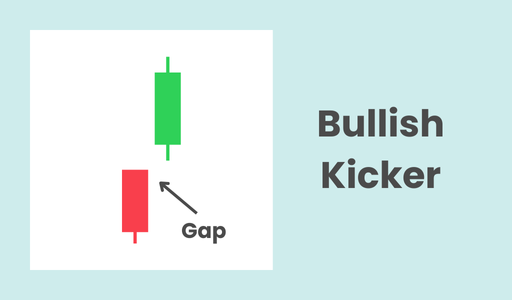
The Bullish Kicker is a rare but powerful two-candlestick bullish reversal pattern. It signals a dramatic and sudden shift in market sentiment from bearish to bullish.
It is one of the most reliable candlestick patterns because of the sharp price action it represents.What to Look For
- First Candle (Bearish): The first candle is a bearish (red or black) candle, which confirms that the existing trend is down.
- Second Candle (Bullish): The second candle is a strong bullish (green or white) candle that gaps up from the first candle. The open of the second candle is often above the high of the first candle, and it continues to move higher, closing near its high.
- The Gap: A key feature of this pattern is the gap between the two candles. The second candle opens at a price level that is a significant jump from the previous day's close, showing an extreme and sudden shift in sentiment. There is no price overlap between the two candles' bodies.
- Appearance After a Downtrend: For the Bullish Kicker to be a valid reversal signal, it must appear after a clear downtrend. It signifies that the bears' power has been completely overwhelmed by a sudden influx of buyers.
- Psychology: The pattern reflects a total and surprising change in attitude. After a period of selling, the market is suddenly "kicked" in the opposite direction, often due to a major news event or a fundamental shift in perception. The decisive gap shows that buyers are willing to step in and pay much higher prices without hesitation.
- Confirmation: Due to its dramatic nature, the Bullish Kicker is considered a strong signal on its own. However, high trading volume on the second candle provides added confirmation of the reversal.

By midweek, the market starts to show its hand.
Monday was noise, Tuesday had its traps, and now Wednesday is when traders either find flow or force trades out of frustration.
Here’s the thing: price isn’t random. It repeats. Over and over.
The same liquidity sweeps, the same fake breaks, the same slow grind before the move.
Once you spot that one repetition, your trading changes forever
You don’t need ten strategies.
You don’t need to catch every candle.
You need one repeating behavior that you know better than anyone else.
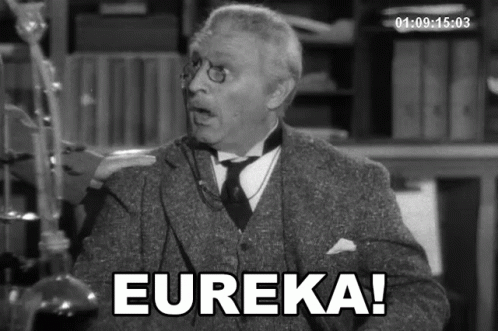
That’s your edge. Your Eureka moment!
That’s what turns trading from guesswork into execution.
Most traders miss it because they’re too busy reacting.
They chase every setup instead of observing the rhythm.
But the eureka moment comes when you realize: the money is made in waiting.
Waiting for the same thing to happen again and again.
So as you line up the rest of this week, stop trying to trade everything.
Watch closely.
Look for that one repetition that always comes back around.
Master it. Ride it.
That’s how you turn Wednesday confusion into Friday confidence.


