
Tech Stocks in Red
....................................................................................................................


What a day.
Thursday started like a victory lap - Nvidia crushed earnings, Walmart flexed strength, and the long-delayed jobs report came in hot. For a minute, it looked like the market wanted to party.
Then noon hit… and everything flipped.
By the close, the Nasdaq had been wrecked, swinging more than 3.5% from its intraday high and ending down over 2%. The S&P tumbled. The Dow cracked. Even crypto rolled over - Bitcoin dropped below $87K, scraping levels we haven’t seen since April.
Nvidia pulled a full plot twist too: up 5% in the morning, down 3% by the bell, despite Jensen Huang practically yelling that demand is “off the charts.”
And the jobs data? Strong hiring, higher unemployment, confused Fed odds - exactly the kind of mixed signal that keeps volatility alive.
It’s Friday, and the market feels tense.
We’re heading into the weekend with bruised tech, shaken crypto, and a Fed path that’s anything but clear.

🚀 Nvidia Surges on Record Q3 – $57B Revenue
Nvidia Corporation delivered a blockbuster third quarter: revenue of US $57 billion (up 62% YoY) and EPS of US $1.30, beating expectations—CEO Jensen Huang called Blackwell chip sales “off the charts.”
📈 Crypto & Tech Stocks Rally Post-Nvidia Blitz
Crypto assets and tech equities climbed after Nvidia’s blowout earnings report—investors interpreted the strength as a green-light for AI infrastructure and risk-on strategies.
⚡ Asia Markets Rocket as Nvidia’s Blowout Earnings Ignite Tech Rally
Nvidia’s blockbuster $57B quarter sent Asian tech stocks surging, with Japan and Korea rallying hard while China lagged on property concern.
🚨 Xiaomi Stock Tumbles, Warns Higher Smartphone Prices Ahead
Xiaomi Corporation stock tumbled after issuing a warning of looming higher device prices, even as explosive EV growth offers some offset. Retail momentum weakened amid cost-pressure signals.
🐻 Meta Stock Plunges Into Bear Territory
Meta Platforms, Inc. shares dropped into official bear market territory (−20%+ from peak), splitting retail traders between “buying the dip” and ditching what they call “AI hype fatigue.”
❌ October Jobs Report Cancelled - Markets On Alert
The Bureau of Labor Statistics announced it will not release the October 2025 jobs report due to data-collection issues caused by the shutdown—leaving policymakers and markets without a key economic signal.
⬇️ Gold Slips as Rate Cut Hopes Fade
Gold dipped toward $4,050 as traders scale back Fed rate-cut bets after officials signaled they may keep rates steady through year-end.

The Market Is Never ‘Too Late’
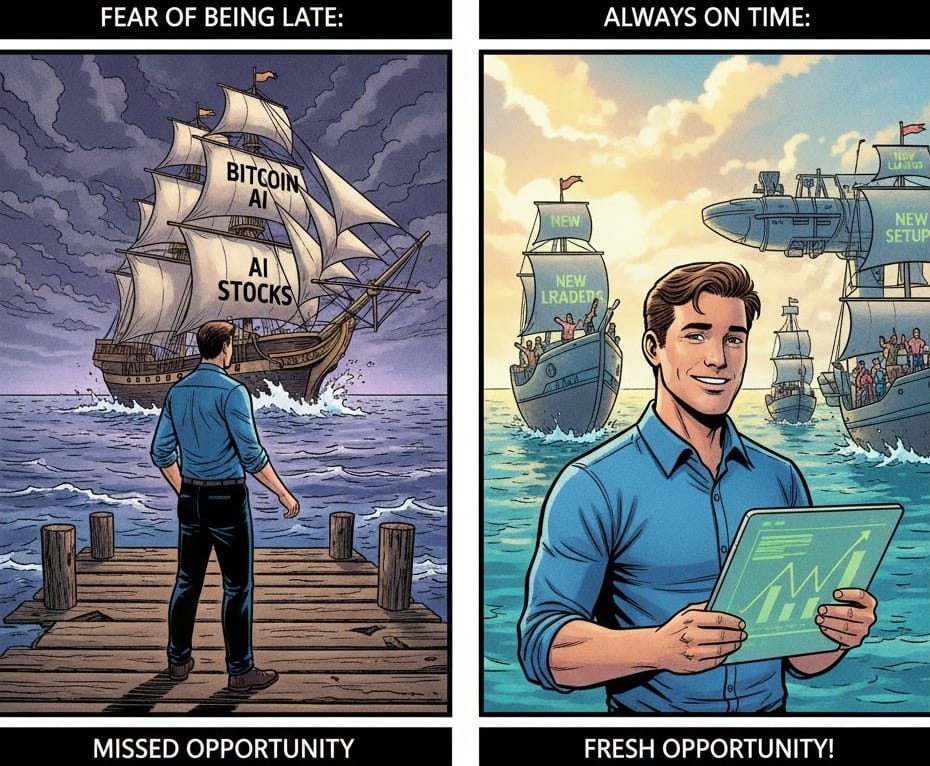
Most traders freeze because they believe the “big move” already happened. They assume the ship sailed with Bitcoin, with AI stocks, with every trend they didn’t jump on early. That fear of being late convinces them to do nothing at all.
But markets don’t operate on one-time chances. Every cycle creates fresh opportunities - new leaders, new trends, new setups. What looks “too late” is often just the middle of a much bigger move. What feels “over” is usually just the beginning for the people who show up prepared.
The truth is simple: you’re not supposed to catch the first chapter. You only need to catch the part that pays. And that window is always open for traders who learn the structure, follow the trend, and stop comparing timelines.
You didn’t miss the market. You just haven’t entered your moment yet.
If you want guidance that helps you stop second-guessing and start spotting real opportunities right on time, these newsletters break it all down step-by-step. They show you how to understand cycles, identify entries, and build confidence without FOMO.

Chaikin Money Flow (CMF)
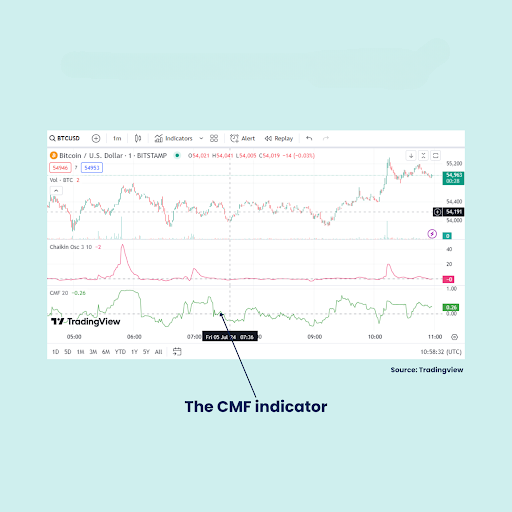
The Chaikin Money Flow (CMF) is a volume-based technical indicator developed by Marc Chaikin, the same developer of the On-Balance Volume (OBV) indicator.
CMF measures the amount of Money Flow Volume over a specific period (typically 20 or 21 periods).
It is designed to gauge the buying and selling pressure in a market by determining whether the asset is accumulating (being bought) or distributing (being sold) based on its volume and its closing location within the high/low range.2 It is an oscillator, meaning its values fluctuate between +1 and -1.
What to Look For (Key Features and Signals)
The CMF is calculated by multiplying the Money Flow Multiplier (which determines the buying/selling pressure based on the close relative to the high/low) by the volume, and then normalizing it by dividing by the total volume over the period.
Here are the key signals traders look for:
- The Zero Line: The Zero Line is the most crucial level.
- Bullish Pressure: A CMF value consistently above the Zero Line indicates sustained buying pressure (accumulation), as the price is closing in the upper half of its daily range on high volume.
- Bearish Pressure: A CMF value consistently below the Zero Line indicates sustained selling pressure (distribution), as the price is closing in the lower half of its daily range on high volume.
- Crossovers (Trend Confirmation):
- Bullish Confirmation: A move from negative territory to above the Zero Line confirms increasing accumulation and reinforces an existing uptrend.
- Bearish Confirmation: A move from positive territory to below the Zero Line confirms increasing distribution and reinforces an existing downtrend.
- The Power of Divergence (Reversal Signal): Divergence between the CMF and price is a strong signal for a potential trend reversal.
- Bullish Divergence: The asset's price makes a lower low, but the CMF makes a higher low. This suggests that while the price is dropping, hidden accumulation (buying pressure) is building, foreshadowing a reversal to the upside.
- Bearish Divergence: The asset's price makes a higher high, but the CMF makes a lower high. This suggests that while the price is rising, distribution (selling pressure) is increasing, foreshadowing a reversal to the downside.
- Extremes (Overbought/Oversold): CMF readings near the extremes (e.g., above +0.25 or below -0.25) are often used to confirm the strength of the buying or selling pressure, but these levels are not typically used as overbought/oversold reversal signals like in the RSI.

The Truth About Pain
Every trader meets pain. Losses. Frustration.
Days where nothing works.

There is no version of this game where you escape it. The real difference is how you respond to it.
Most traders try to outrun pain.
They revenge trade.
They double size.
They chase the next move hoping it will erase the discomfort.
That only makes the damage worse. Pain grows when you fight it with impulse.
Strong traders face pain with honesty.
They stop. They breathe.
They look at the loss with clear eyes and ask a simple question.
What did I do here.
Not to shame themselves.
Not to dramatize it. Only to learn.
Pain teaches you more than any winning streak.
It sharpens your awareness.
It exposes the habits that sabotage you.
It forces you to build discipline instead of ego.
When you handle pain with composure, you turn it into fuel instead of fire.
Trading will not reward the trader who avoids discomfort.
It rewards the one who can sit with it, study it, and keep executing even when it stings.
That is the truth about pain. You grow from it or you get ruled by it.


