Tariffs Trigger Panic
....................................................................................................................


Good morning, traders!
As we brace for another day in the markets, it's evident that volatility remains high.
President Trump's impending "Liberation Day" tariffs have sent ripples through global markets, with investors seeking refuge in safe-haven assets like gold, which has recently surged to record levels.
Remember, while the markets may be unpredictable, maintaining a balanced portfolio can help you navigate these choppy waters.
Let's get into today's crucial updates and analysis and chart a course through the financial currents together.

🏷️ TikTok Sale Imminent: How Will Markets React?
President Trump anticipates finalizing a deal for TikTok's U.S. operations before the April 5 deadline, aiming to address national security concerns.
🐂 Rare Bullish Signal Flashes Amid Market Troubles
A rare bullish indicator, with a flawless track record since the 1960s, has emerged, pointing towards potential record highs in the stock market.
⏳ Tariff Deadline Draws Near - Stock Futures on Edge
U.S. stock futures decline as President Trump's deadline for imposing reciprocal tariffs nears, intensifying market uncertainty.
🥇 Gold Prices Break Records Amid Trade War Jitters
Gold prices surge above $3,100 per ounce, reaching a new record as investors seek safe-haven assets amid escalating trade tensions.
〽️ Bitcoin Drops Below $85K as Bears Tighten Grip
Bitcoin's price declines below the $85,000 mark, with bears gaining strength under the $83,500 support, signaling potential further losses.
🏦 Bonds Climb as Tariff Fears Mount
U.S. stock index futures fall as investors shun risky assets, driven by concerns that the administration's sweeping tariffs could trigger a recession.
🛢️ Oil Prices Dip Despite Tariff Threats
Oil prices slip as markets weigh the impact of potential secondary tariffs on Russian and Iranian oil, alongside broader trade war concerns.

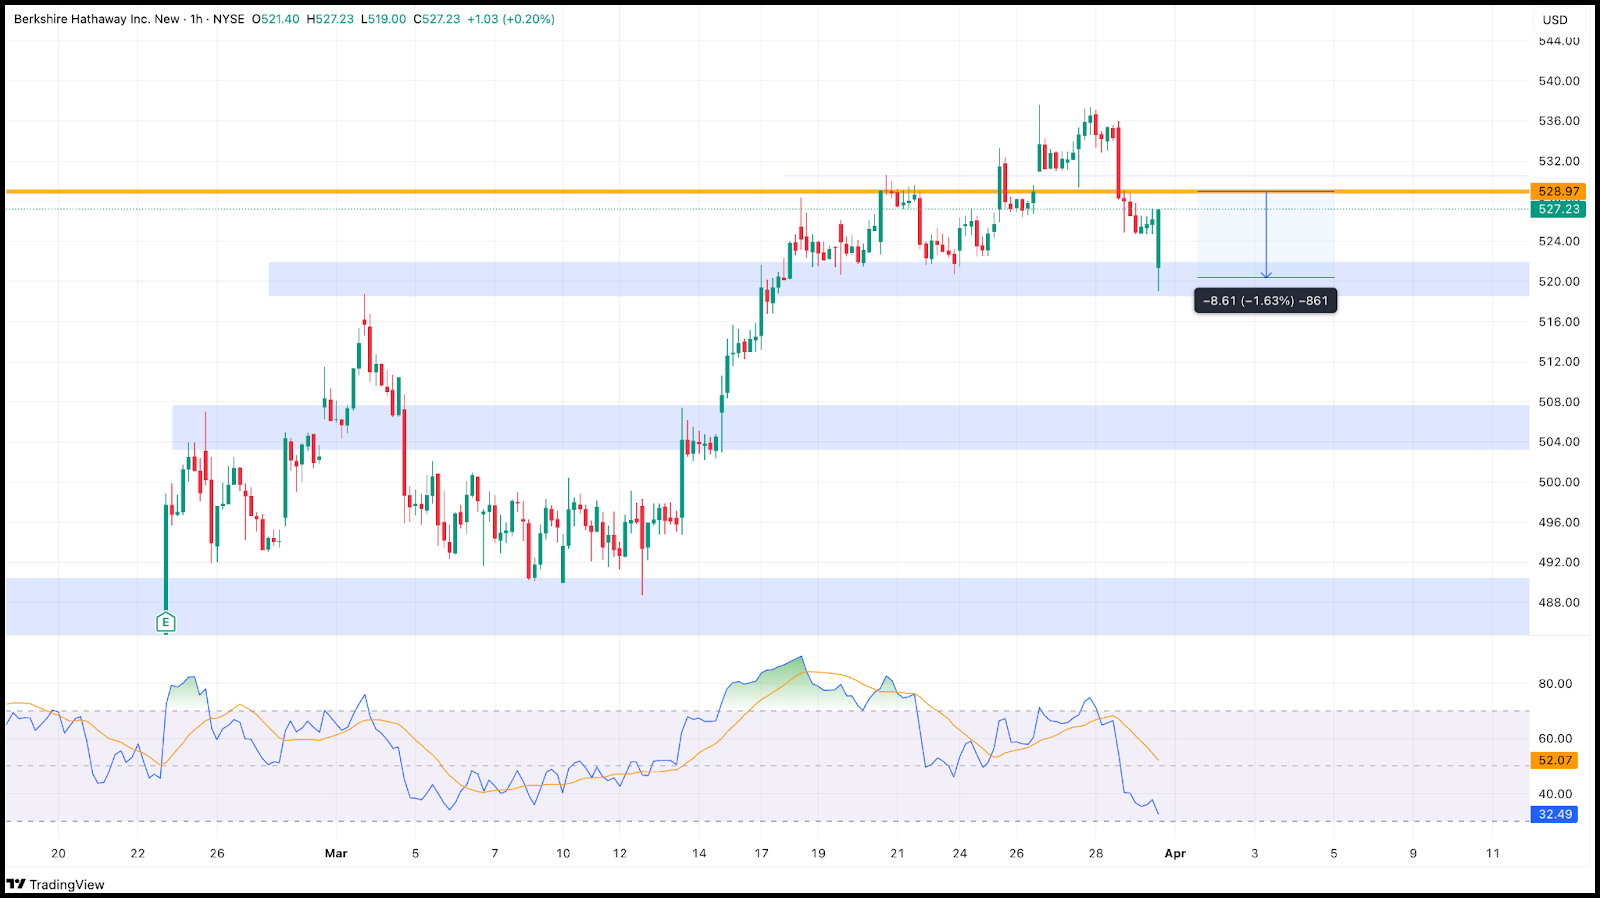
Berkshire Hathaway Inc. (NYSE: BRK.B) TP 1 hit
We waited patiently for days for BRK to drop - and it finally gave us the entry.
📉 Shorted at $528.96
📈 Took profit at $520.33 for a 1.62% gain (before leverage)
TP1 hit. Half profits secured, and the rest is now risk-free with SL moved to breakeven.
Textbook execution. 💥

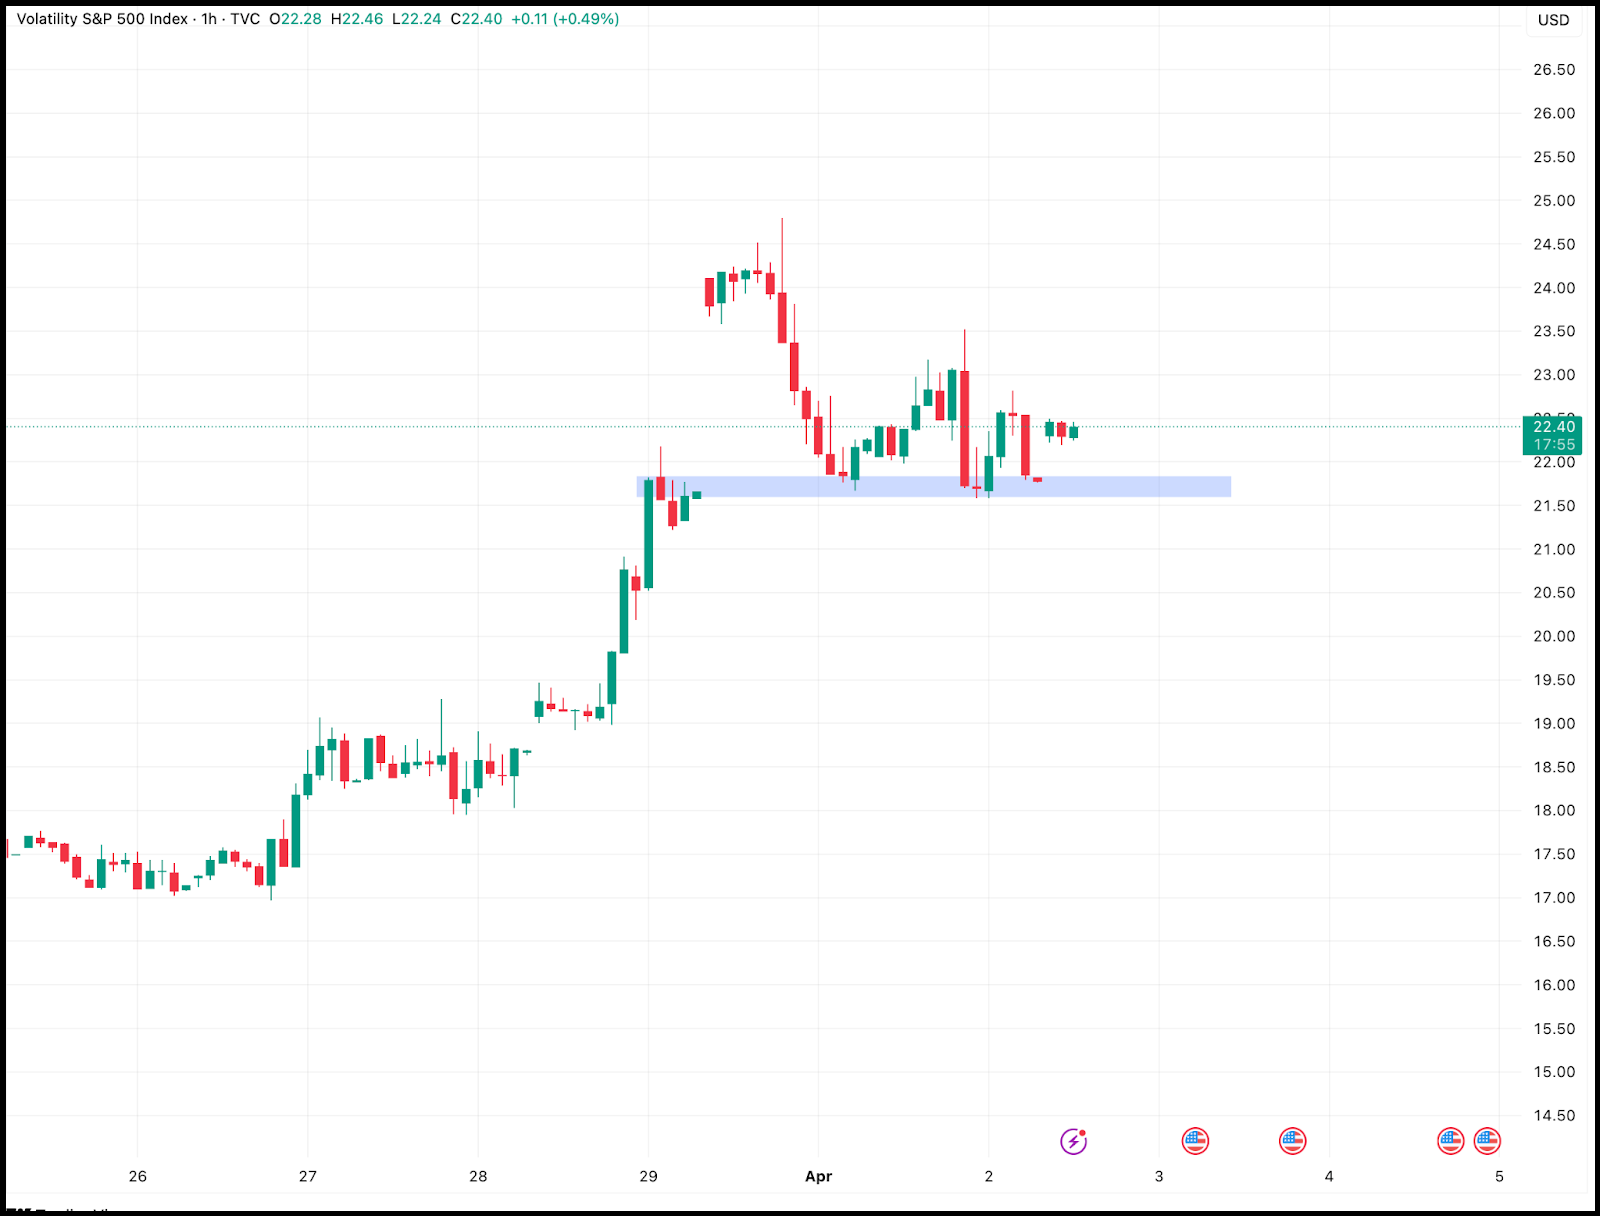
💡 What is the VIX?

The VIX, often called the “Fear Index,” tells us how nervous the market is feeling.
It doesn’t track actual price movements - but rather how volatile traders expect the market to be over the next 30 days.
Right now, the VIX is sitting on a key support level.
If it breaks below this zone, it usually means fear is fading - and when fear drops, stocks tend to climb*
That’s when I’ll start hunting for fresh, winning setups for you.
But for now, we wait.
Let’s see what tomorrow reveals.

Think You’re the Underdog Against Wall Street’s Robots? Here’s How to Fight Back!
Going up against high-frequency traders can feel like stepping into the ring with a heavyweight champion.Fast, relentless, and seemingly unbeatable.
Their algorithms process data and execute trades in milliseconds, leaving retail traders scrambling to keep up.
But you don’t have to stay at a disadvantage.
AI newsletters break down the principles behind high-frequency trading and show you how to adapt your strategies to level the playing field.
Learn how to fight back and trade smarter with these newsletters!

Rising Wedge
A Rising Wedge is a bearish reversal chart pattern that signals a potential downtrend after an uptrend.
It's characterized by converging trend lines that slope upwards, forming a wedge shape.
What to Look For:
- Converging Trend Lines: The upper and lower trend lines of the pattern converge as the price advances.
- Upward Slope: Both trend lines slope upwards, indicating a series of higher highs and higher lows.
- Decreasing Volume: Volume typically decreases as the pattern progresses, suggesting weakening buying pressure.
- Breakdown Below Lower Trend Line: The pattern is confirmed when the price breaks below the lower trend line, signaling a potential reversal.
- Bearish Confirmation: The breakdown should ideally be accompanied by an increase in volume to validate the bearish signal.
- Occurs After Uptrend: The pattern is most reliable when it forms after a sustained uptrend.

The Flipping Trap
Flipping accounts is one hell of a drug.
That rush of turning $50 into $500 overnight?
Feels like you cracked the market’s secret code.
But let’s cut through the hype - this mindset is a straight-up account killer.
At first, flipping feels like magic.
You hit a few big wins, your confidence skyrockets, and suddenly you think,
"Who needs a big account?
Skill is all that matters!"
Then—BAM!—one bad trade, and that “magic” disappears faster than your weekend plans.
You ever see those traders flexing their “$50 to $5K” screenshots, claiming “Capital isn’t your problem, skill is”?
Yeah, they conveniently forget to mention the blown accounts, the stress sweats, and the nights staring at charts like a detective hunting for clues.
Here’s the truth - any money you make by breaking your rules isn’t really yours.
The market will snatch it back.
It’s only a matter of time.
If you’re gonna flip, do it with money you can afford to lose - not your rent, not your savings, not your peace of mind.
Because at the end of the day, trading isn’t about gambling big - it’s about stacking consistent wins.
Play the long game.
That’s how you stay in it.


