Tariff Shock Hits Stocks
....................................................................................................................


There’s something about a perfectly timed market move that gets our hearts racing.
A whale buys in, Bitcoin spikes, the S&P 500 flips green - and suddenly, we’re glued to the charts, crafting the perfect breakdown.
This week has been rough though: Markets took a hit after Trump dropped 25% tariffs on Canada and Mexico while doubling China’s duties to 20%, sparking a sell-off.
Canada fired back with its own tariffs, and China piled on 15% duties on U.S. farm products.
The damage?
The S&P 500 erased all post-election gains, and the Dow slid to a 4-month low.
But is this a true warning sign or just a dip before the rip?
Latest reports say Trump has paused the Canada and Mexico tariffs until April.
Traders aren’t loving the on-again, off-again chaos, but uncertainty is the name of the game - we trade what’s in front of us.

🧋 SBUX Bulls Cheer as Starbucks Names New CFO!
After appointing Nordstrom exec Cathy Smith as CFO, SBUX sentiment remains bullish. With major strategic shifts underway, could this fuel even bigger gains?
🏷️ Best Buy Tanks 13% – But Retail Traders Buy the Dip!
Despite stronger-than-expected Q4 results, Trump’s new tariffs sparked panic, sending BBY down 13%. But retail traders? They see a buying opportunity.
💥 $1B Wiped Out as BTC Nosedives!
Bitcoin’s drop below $83,000 sparked mass liquidations, with long traders taking the biggest hit. But analysts still see a bullish comeback—who’s right?
🇺🇸 US. Markets Tank as Trump’s Tariffs Ignite Trade War Fears
U.S. stock markets took a hit as fears of a full-blown trade war intensified. Trump’s new tariffs on Canada, Mexico, and China triggered a sharp sell-off, with the S&P 500 closing at its lowest level since his election.
🇪🇺 European Stocks Jump on Stimulus, Tariff Hopes; DAX Rallies 2.6%
Germany just unleashed €500B on defense and infrastructure, sending DAX soaring 2.6%. Traders cheered, Siemens Energy jumped 6.4%, and even cement stocks got in on the action. Meanwhile, whispers of U.S. tariff rollbacks have bulls charging.
🛢️ Oil Tanks as OPEC+ Pumps More!
OPEC+ just decided to increase output for the first time since 2022 - bad news for oil bulls. Brent slid to $70.89, while WTI dropped to $67.86, with fears that Trump’s tariffs on energy imports will hammer demand.
🌡️ Dow Tanks 650 Points as Trade War Heats Up!
Markets tumbled after Trump slapped fresh 25% tariffs on Canada & Mexico, doubling China’s duties to 20%. The S&P 500 erased all post-election gains on Wednesday, while the Dow plunged 650 points to a 4-month low.

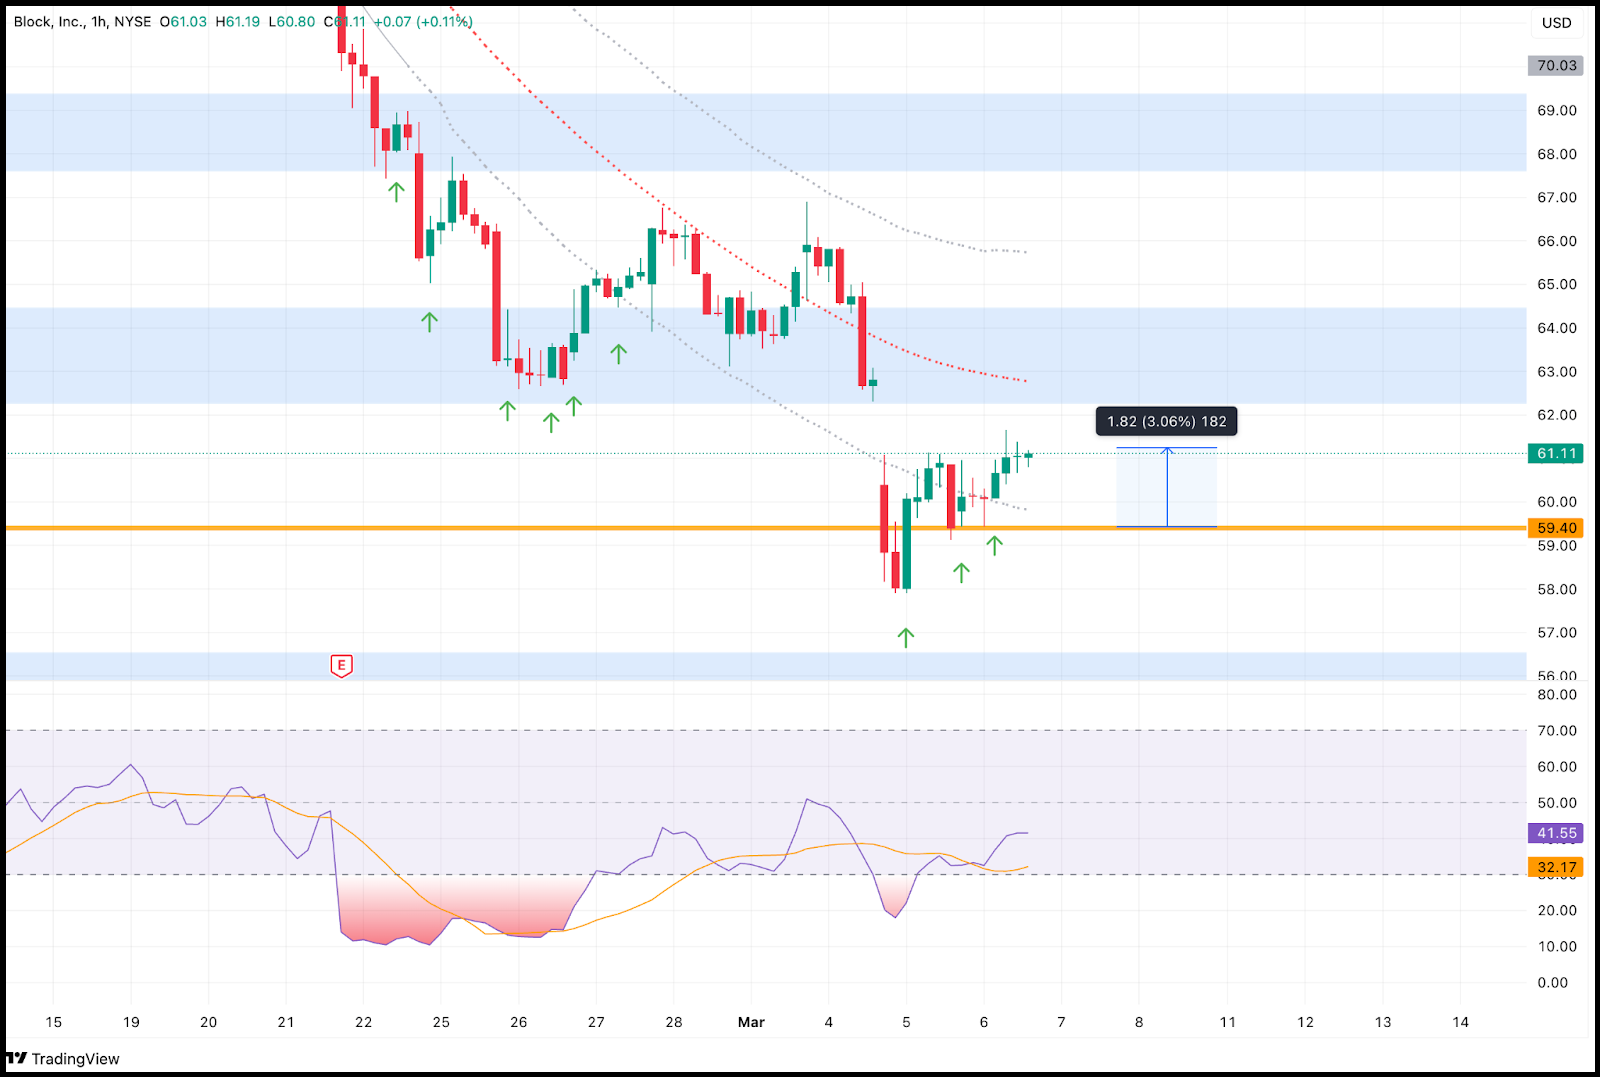
Block Inc (NYSE: SQ)
We recommend a buy for SQ at 59.40.
The moment market open.
It started flying and I close off at $61.25 for a 3.06% gain.
What a great 1 day trade!

Think You’re Juggling Too Many Trading Tasks? Here’s How AI Catches the Balls!

Trading can feel like a nonstop juggling act.Analyzing charts, researching trends, managing positions, and executing trades.
It’s overwhelming, and one misstep can throw everything out of sync. But you don’t have to do it all alone.
AI tools can take over the heavy lifting, automating research, generating signals, and even executing trades with precision.
These newsletters showcase the best AI-driven solutions to streamline your trading routine.
Discover how to save time and trade smarter with the help of these newsletters!

Relative Strength Index (RSI)
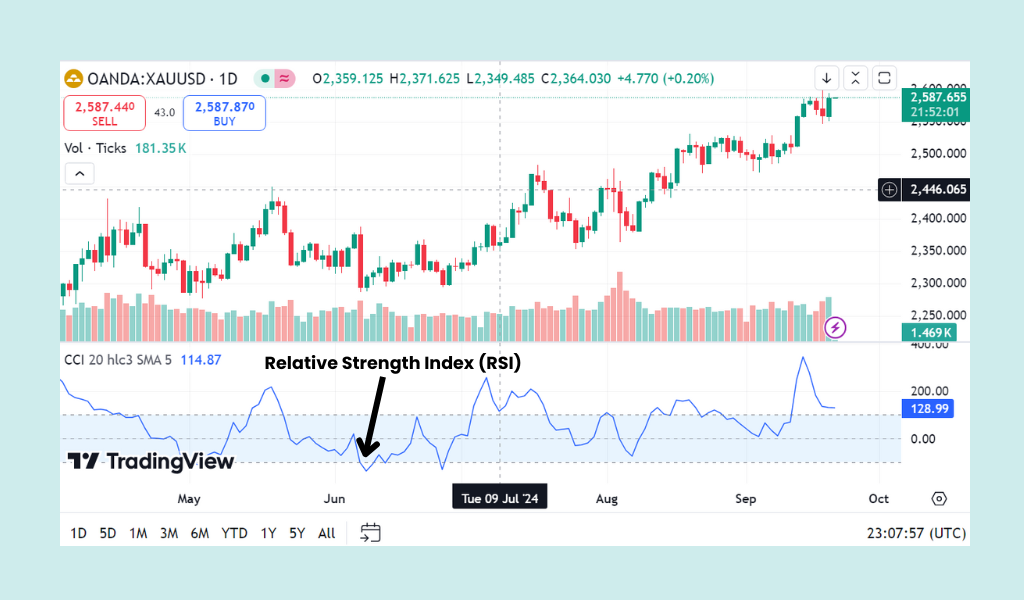
The Relative Strength Index (RSI) is a momentum indicator used in technical analysis that measures the magnitude of recent price changes to evaluate overbought or oversold conditions in the price of a stock or other asset.
What to Look For:
- Overbought/Oversold Levels:
- RSI values above 70 are often considered overbought, suggesting a potential price reversal downwards.
- RSI values below 30 are often considered oversold, suggesting a potential price reversal upwards.
- Centerline Crossovers:
- Crossovers above and below the 50 centerline can indicate shifts in momentum.
- Crossovers above and below the 50 centerline can indicate shifts in momentum.
- Divergence:
- Divergence between the RSI and price action can signal potential trend reversals. For example, if the price is making higher highs, but the RSI is making lower highs, it could indicate a weakening uptrend.
- Divergence between the RSI and price action can signal potential trend reversals. For example, if the price is making higher highs, but the RSI is making lower highs, it could indicate a weakening uptrend.
- Failure Swings:
- Failure swings are a type of divergence that can indicate a strong potential reversal.

LOSSES ARE YOUR BEST TEACHERS!
Every trader dreams of winning big, but let’s be real - losing stings.
You take a few hits, your confidence shakes, and suddenly, quitting seems like the best option.

But here’s the truth: EVERY great trader has been there.
The difference?
They kept going.
Think of trading like hitting the gym. You don’t walk in, lift once, and expect to be ripped. You sweat, struggle, fail - but each rep makes you stronger.
Trading works the same way.
Every loss isn’t a sign to quit - it’s a rep in the gym of market mastery.
The traders who make it aren’t the ones who never lose.
They’re the ones who take the punches, learn from them, and show up again.
Every trade you take sharpens your skills.
Every mistake teaches you something new. Every loss brings you one step closer to winning.
So don’t let a few red days knock you out of the game.
Analyze, adjust, and take the next trade.
Because the only way you truly lose in trading… is if you give up.