Surge Alert! Bitcoin Breaks 100k!
.................................................................................................................................


Fridays feel different, don’t they?
The week slows down, the markets calm a bit, and the weekend gives you a chance to breathe.
But for traders, Fridays are a moment to check in.
Did you move closer to your goals, or are you still figuring things out?
Now, let’s talk Bitcoin. It finally hit $100K yesterday—huge news!
But before anyone could celebrate, it dropped rapidly to $93K. Crazy, right?
Luckily, it rebounded fast.
Now the big question is: will it keep climbing, or is a big crash coming?
As you head into the weekend, think about this: what are you doing today to prepare for what’s next?
The last section in this newsletter might just give you a clue.
It's time for you to take action!

🏆 Bitcoin Hits $100K, Then Drops
Bitcoin soared past $100K for the first time, only to drop to $93K hours later. Could more surprises be coming?
🚧 Gold Stands Still Ahead of US Jobs Data
Traders are on edge, waiting for key numbers. Will gold hold its ground or make a move? All eyes are on the next report.
🇰🇷 Asia Markets Cautious Amid South Korea Troubles
Political turmoil keeps investors on their toes. Mixed signals across the region. Stability or more volatility ahead?
🗳️ Euro Holds Steady Before French Vote
The euro stands still, but for how long? France’s fragile coalition faces a no-confidence test. Big moves could be coming.
🧗 Nasdaq, S&P 500 Hit Record Highs
Wall Street keeps climbing, but for how long? Investors await fresh data. Is this the peak or just the start?
🏦 Broader Markets Stay Mixed Amidst Fed Comments
Nasdaq reaches new heights. Broader indices show hesitation. Will the trend continue? See stock movers here.
⚠️ Is Bitcoin Set to Crash Again?
BTC shows signs of weakness. Another drop on the horizon? Traders are watching closely for the next signal.

The market has been moving rather slowly recently, primarily due to the S&P 500 reaching new all-time highs.
While our three recommended positions are progressing according to plan, they still need time to reach our target prices.
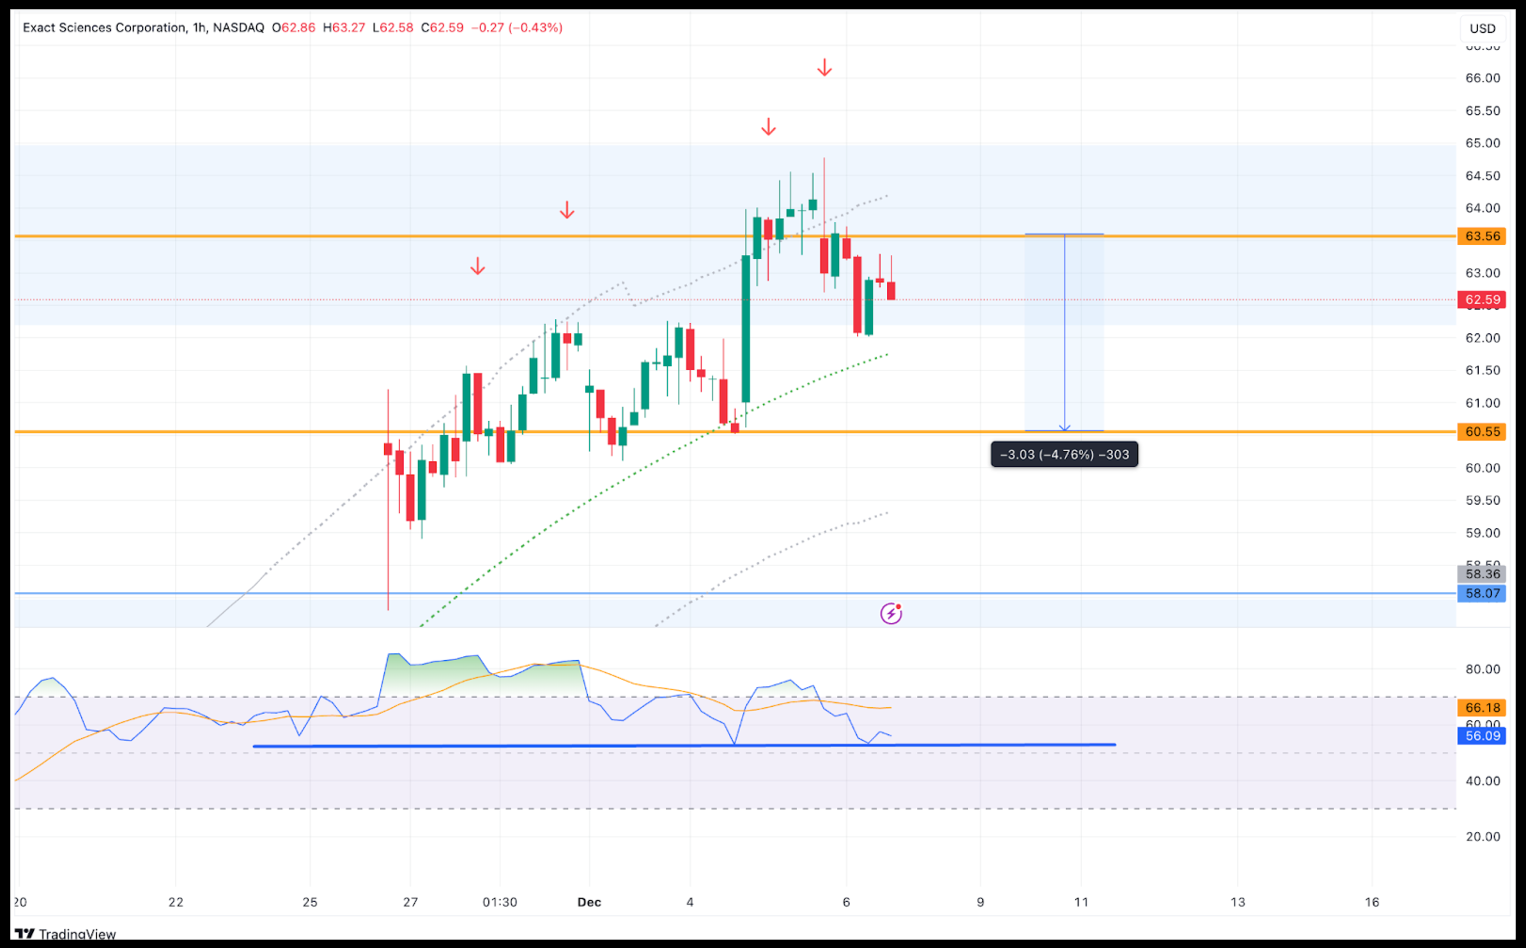
Regarding Exact Sciences Corporation (EXAS), I've established a second short position at $63.56.

The current price is trading below this second entry point, and I'm waiting for it to reach our first entry level before making any decisions about closing the position.
We'll monitor its progress over the next few days.
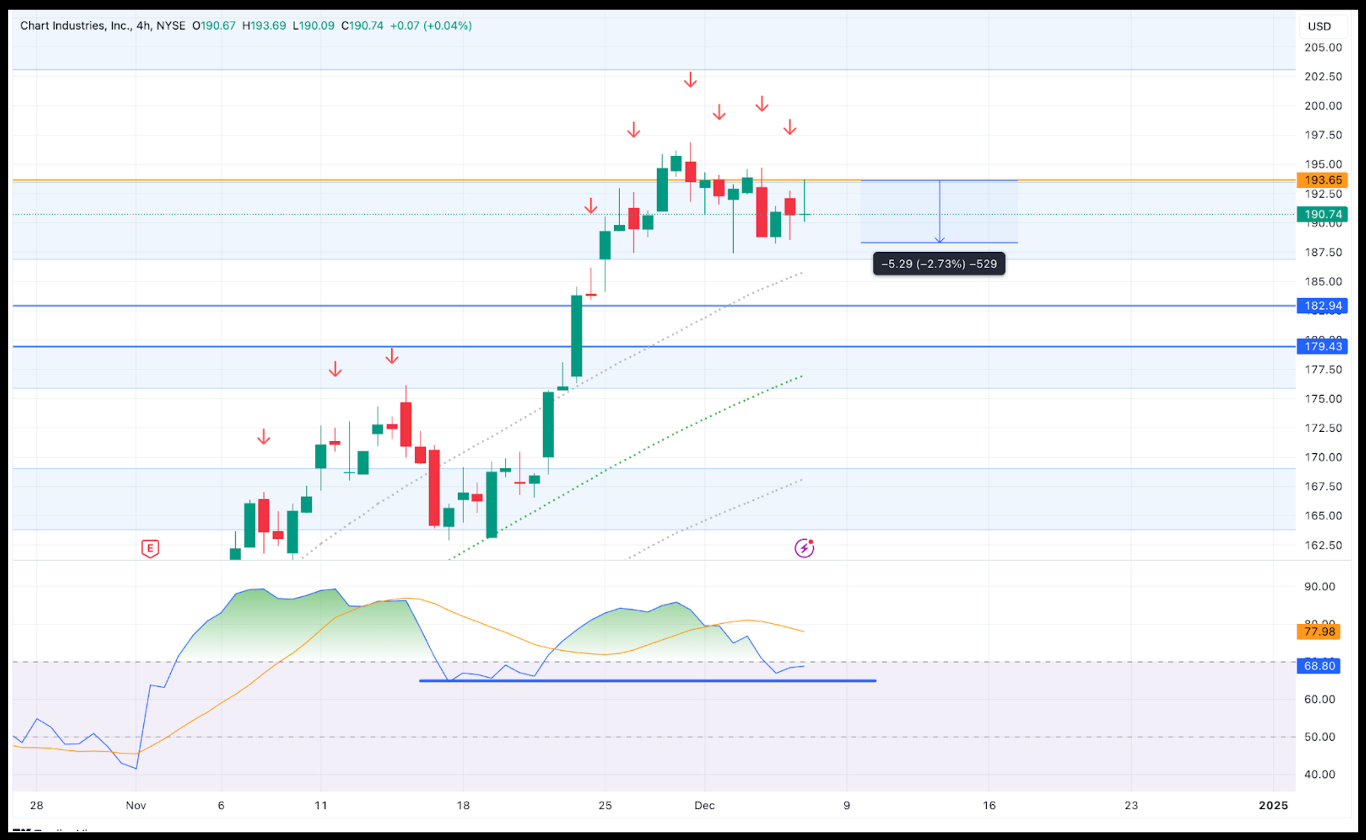
Chart Industries (GTLS) is performing as expected, with the price below our short entry and reaching a decline of 2.73% yesterday.

I'm maintaining this position as I anticipate the RSI to cross over, which should drive the price even lower.
With major indices at all-time highs, finding attractive entry points has become more challenging.
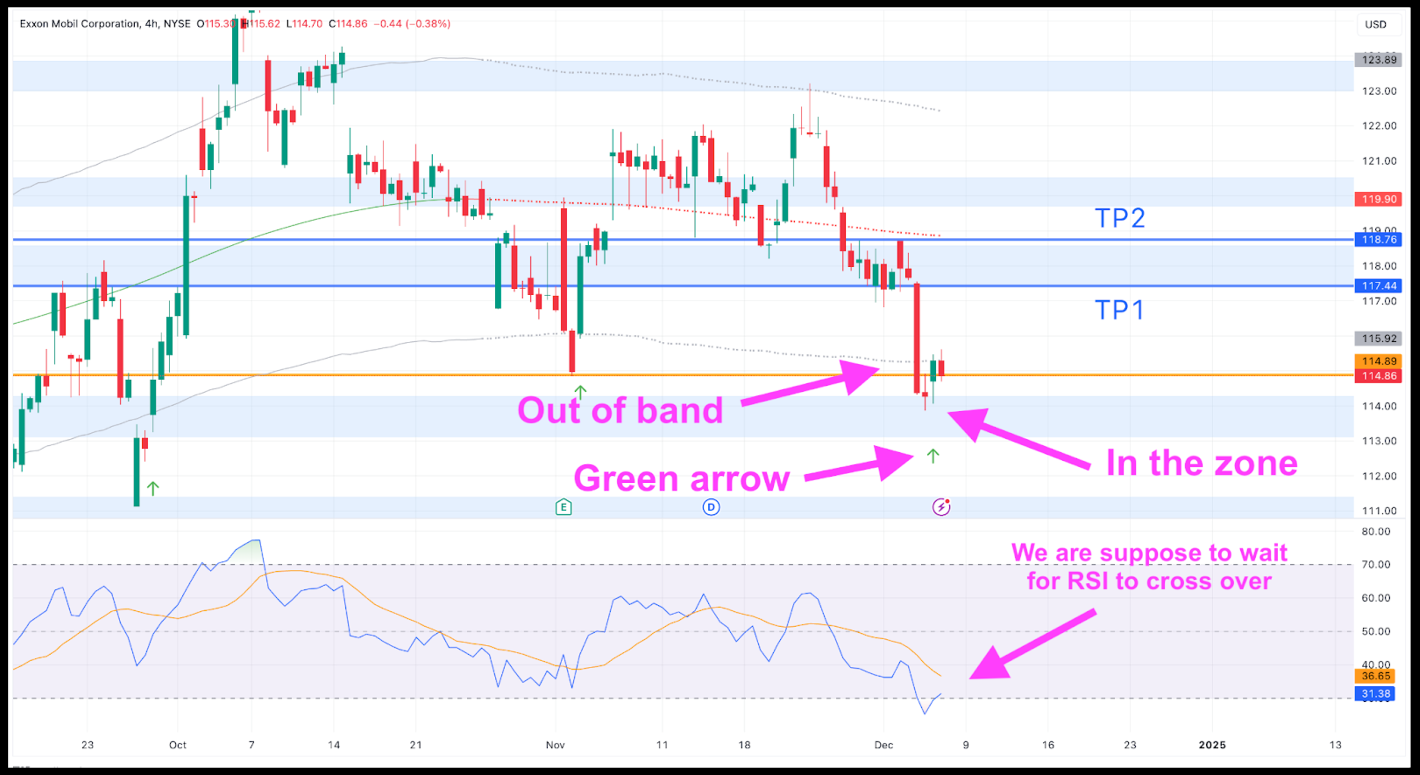
However, I've identified one potential opportunity in Exxon Mobile (XOM).

The stock is currently trading in a sideways pattern, which presents opportunities to trade between support and resistance levels.
The price has now dropped into a support zone, and although the RSI hasn't crossed over yet, I've decided to enter a position.
I recommend entering a LONG position at $114.89
• First Take Profit at $117.44
• Second Take Profit at $118.76
If the price continues lower, I plan to add another position at the next support zone.
As this is a swing trade setup, expect to hold the position anywhere from several days to two weeks before reaching our profit targets.

No Time to Trade? Here’s How to Fit It Between Netflix Episodes!
Think you’re too busy to trade?
With a full-time job, family responsibilities, and, let’s be real, your favorite shows to binge, it’s easy to assume trading is out of reach.
But here’s the secret: it doesn’t have to take hours.
These newsletters are like your trading shortcut, breaking everything down into quick, actionable insights that fit into even the busiest schedules.
Click here to see how you can start trading smart, even if you only have time between episodes.

Inverted Hammer
An Inverted Hammer is a bullish reversal candlestick pattern that signals a potential uptrend after a downtrend.
It is characterized by a long upper wick, a small body, and a relatively small lower wick.
What to Look For:
- Long Upper Wick: The upper wick of the Inverted Hammer candle should be significantly longer than the body of the candle.
- Small Body: The body of the Inverted Hammer candle should be small, indicating indecision among market participants.
- Small Lower Wick: The lower wick should be relatively short, suggesting that sellers were unable to push the price lower.

Don’t Forget to Pay Yourself! 🏖️
After all those trades, how about treating the real MVP—you?
Seriously, when was the last time you stepped outside, took a deep breath, and felt the grass under your feet?
Here’s the vibe:
- Get your eyes checked (you’ve been staring at charts too long).
- Call that friend you keep ignoring.
- Go laugh, eat something fancy, or even pray a little—whatever makes your soul happy.
Trading’s important, but so are you.
Joy isn’t something your next of kin can cash in, so live it up, relax and enjoy your weekend!

It might be Friday, but it’s never too late to turn things around.
If you haven’t started on a system that builds consistent profits, what are you waiting for?
The TAD System (10 Percent A Day) is designed to get you on track—no more guesswork, no more wasted weeks.
Whether it’s Monday or Friday, the best time to start was yesterday; the next best time is now.
Ready to see how you can make consistent gains? Click here to start today.


