
Street Buys Apple
....................................................................................................................


Happy Friday, traders.
After a record-setting run this week, Wall Street is cooling off. Futures are drifting lower this morning - Dow and S&P 500 down about 0.1%, Nasdaq just under the flat line.
The pause comes right after the Dow cracked above 46,000 for the first time ever, marking yet another milestone in a year that refuses to quit.
Why the hesitation?
The Fed rate cut expected next week is now seen as a done deal.
Traders are digesting the rally, weighing inflation prints, and asking: has the market already priced in the good news?
With stocks at all-time highs and the weekend ahead, this is a moment to breathe, review, and prepare.
Next week’s CPI, PPI, and the Fed decision could be the spark for the next leg higher or the excuse for a pullback.
For now, consider today the calm before the storm.

📈 Wall St. Creeps Up
Futures are green, but barely. Traders are stalling out until CPI and PPI drop later this week. iPhone 17 hype is here, but Wall Street’s not sure new AirPods can juice sales.
🚀 Eightco Explodes 5,600%
From $1.45 to $83 in hours - retail went max bull as traders piled into the madness.
🎬 This Blockbuster Stock Pops 35%
Three sessions, nonstop upper circuits—big money is jumping in.
💻 Tech Stocks Sparkle
Infosys, Coforge, and Wipro led a broad IT rebound as the index snapped a 5-day skid.
🏦 Fed Hope Lifts Stocks
Traders are shrugging off France’s mess, betting on a U.S. rate cut next week.
🐻 Kering Bears Circle
Short bets hit decade highs, piling pressure on new CEO Luca de Meo.
🪙 Gold Smashes Record
Spot hit $3,659 as traders bet big on Fed cuts and a softer dollar.

Archer Daniels Midland Company (NYSE: ADM) – TP Hit!
That’s a clean one.
Price dropped right into our zone and gave us exactly what we were looking for.
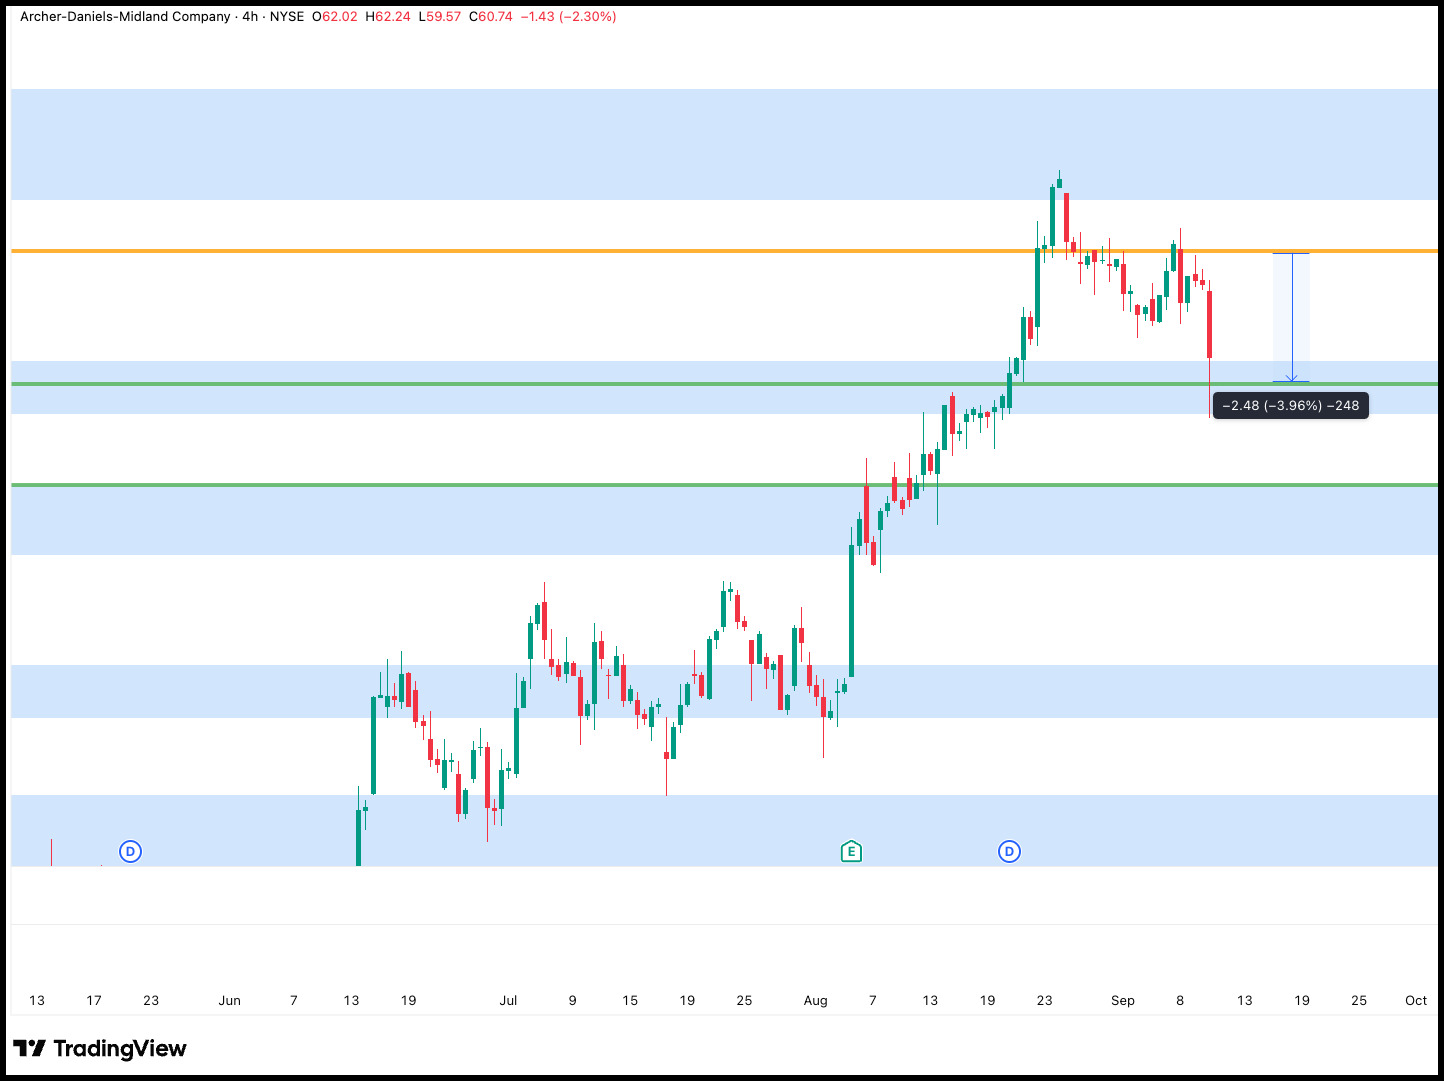
This move locked in 3.96% gains before leverage.
When the setup is this clear, there’s nothing to overthink.
Just follow the plan and let the market do its thing.
Another one closed and in the books. ✅

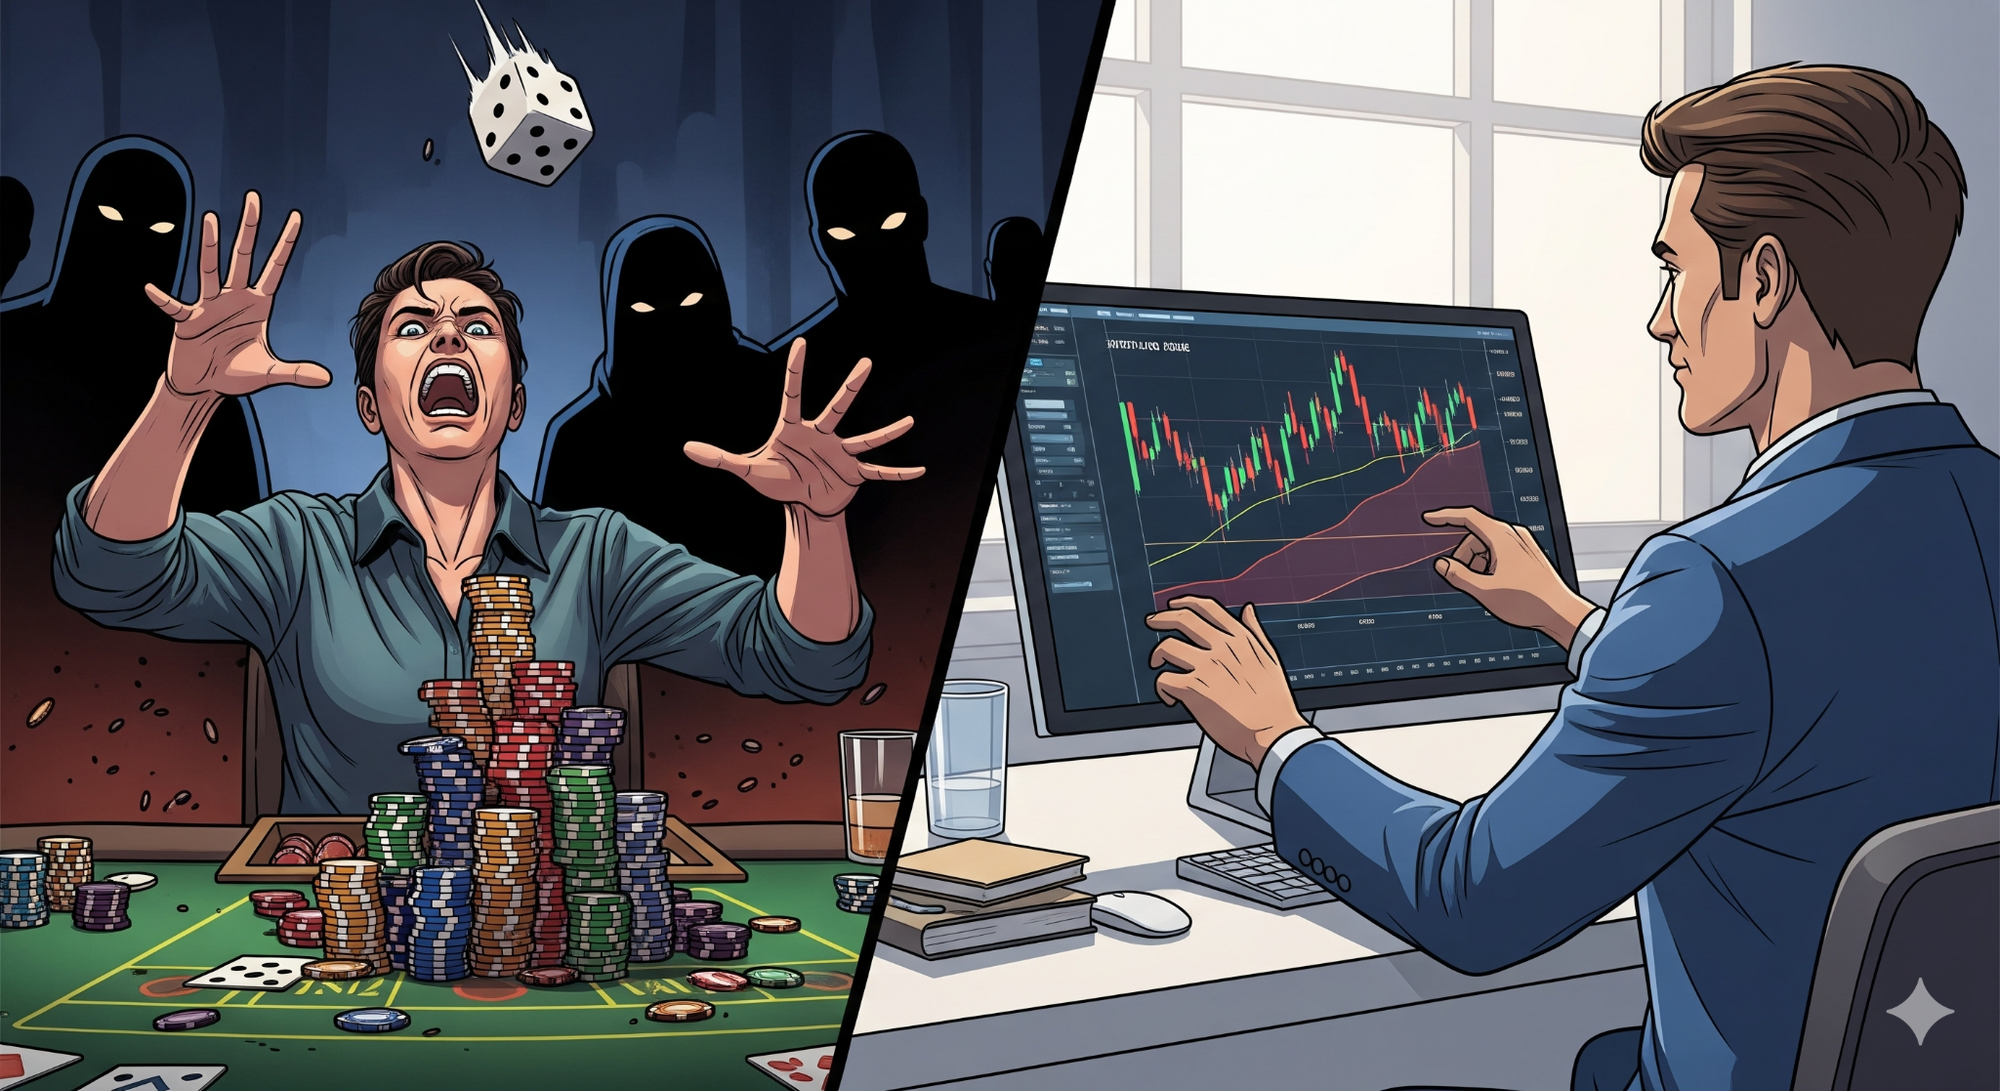
The Market Isn’t a Casino, Unless You Treat It Like One
A lot of new traders step in thinking it’s all-or-nothing.
Place a big bet, hope for the jackpot, and if it doesn’t work out - well, “that’s trading.”
But that’s not trading. That’s gambling.
The difference comes down to risk management.
Traders who survive and thrive don’t throw everything at one roll of the dice.
They size their positions, set stop-losses, and protect their capital so they can keep playing the game tomorrow.
Without a risk plan, every trade feels like spinning a roulette wheel.
With a plan, the market stops looking like a casino and starts looking like a place where skill, patience, and discipline stack the odds in your favor.
That’s why trading newsletters matter.
They point out the opportunities and show you how to manage risk. They also help you avoid the blow-ups, and keep your account alive long enough to actually grow it.
👉 The market isn’t a casino - unless you treat it like one.
Start trading smarter here

Tweezer Top
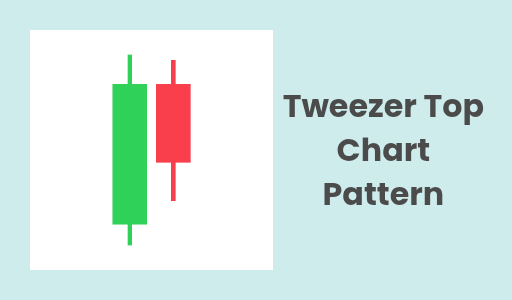
The Tweezer Top is a two-candlestick bearish reversal pattern that appears at the top of an uptrend.
It signals that buyers were unable to push the price higher and that a potential change in market direction is coming.
The name "tweezer" comes from the two candles having nearly identical highs, which visually resemble a pair of tweezers.
What to Look For
- Two Candlesticks: The pattern is made up of two consecutive candles.
- Identical Highs: This is the most crucial characteristic. Both candles must have the same or nearly the same high price. This forms a strong resistance level.
- First Candle (Bullish): The first candle is bullish (green or white), representing the continuation of the current uptrend.
- Second Candle (Bearish): The second candle is bearish (red or black). It tests the high of the first candle and then reverses sharply, closing lower.
- Appearance After an Uptrend: For the Tweezer Top to be a valid reversal signal, it must appear after a clear period of rising prices. It shows that the buying pressure is exhausted.
- Psychology: The first candle confirms the existing uptrend by hitting a new high. However, the second candle's inability to break above that same high shows that sellers have stepped in at that exact price level, creating a strong resistance zone and rejecting further advances.
- Confirmation: The Tweezer Top is a strong signal, but traders often wait for confirmation from the next candle. A strong bearish candle following the pattern, a move below the low of the second candle, or increased trading volume can all help to confirm the reversal.

Market Psychology on Steroids
We’re heading into the weekend, and this is the perfect time to step back and think about how the week usually begins.
If you’ve ever taken a trade early on Monday and watched the market whip against you before eventually running in your direction, you’ve experienced the “opening dance.”
Here’s what to watch for next week: a bearish week often kicks off with a buy.
Price sweeps liquidity above, triggers stops, and only then starts its real move down.
A bullish week usually starts with a sell.
The market dips first, cleans out liquidity below, then climbs.
It’s the way price builds fuel.
If you can’t recognize the sweep, you risk being the liquidity that gets taken.
Use the weekend to review your charts and spot these patterns.
Come Monday, you’ll be ready to trade with the narrative instead of against it.


