Starbucks Downgrade 🔻
....................................................................................................................


Good morning and welcome to June - finally.
After weeks of charts that looked like they were on vacation… the market actually moved.
Yep, the S&P 500 just clocked its best May in 35 years.
You read that right - since 1989, when people still used floppy disks and wore suspenders unironically.
What sparked the run?
A tariff truce twist.
Trump’s attempt to bring back EU tariffs hit a legal wall, and Wall Street hit the gas.
Now traders are asking: Is this a new trend… or just another fake breakout with good PR?
Meanwhile:
- Nasdaq ripped nearly 10% last month
- Jobs data and wage growth numbers are coming this week
- And Starbucks just got a downgrade - maybe caffeine's not enough to jolt those earnings anymore.
So yeah, traders are cautiously optimistic, sipping their coffee a little slower, and praying June doesn’t start off with a nasty reversal.
Let’s get into the crucial updates you actually need this morning 👇

☕ Starbucks Loses Steam
Markets ticked up after Trump’s tariff power got clipped but Starbucks is cooling fast. TD Cowen just downgraded the stock as labor risks and weak growth pile up.
⏬ Futures Fall as Tariff Fears Return
Trump reignites tensions with China, calling them out just weeks after a truce. Meanwhile, inflation cools - but markets are still sweating.
👀 Markets Rise... but Hold Your Breath
A late court ruling clipped Trump’s tariff powers but the relief rally could be short-lived. Analysts warn: This market's skittish and swings fast.
⛔ Bitcoin Hits the Brakes — For Now
After a run to $111K, Bitcoin’s cooling off but analysts call it a “healthy pause.” One sees $220K+ in 2025 if momentum returns post-Fed and post-tariffs.
➖ Tariffs Hit the Gap Hard
Markets dipped slightly as investors held their breath for fresh inflation data. Gap dropped 15% despite beating earnings — tariffs could cost it $300M this year.
🚨 Oil Drops, Drama Builds
Crude prices slipped as Trump’s tariffs whipsawed through courtrooms and OPEC+ readies for a possible output boost. Kazakhstan’s rebellion? Adding fuel to the fire.
📝 Gold Slips Before PCE Drop
Spot gold fell to $3,300 as a stronger dollar and Fed jitters weighed on prices. All eyes now on Friday’s inflation report to shape rate cut bets.

The Market’s on Mute Today
Stared at the charts.
Zoomed in. Zoomed out.
Still nothing worth pulling the trigger on.
No clean setups. No solid edge. Just noise.
So we chill.
Not every day’s a hunting day.
Some days are just about keeping the bullets dry.
We’ll strike when the market actually says something. 🎯💼

You Don’t Need a Suit and Tie to Beat the Market

Too many new traders hold themselves back because they think they need a finance degree, a fancy job title, or Wall Street connections to succeed.
That’s a myth - and it’s costing them real opportunities.
The truth is, trading success comes from learning practical strategies, not memorizing economic theory or decoding hedge fund lingo.
These trading newsletters are built exactly for self-taught traders.
They break down complex ideas into simple, actionable insights - no jargon, no intimidation, just step-by-step guidance designed for people who don’t have time to go back to school.
You’ll learn how real traders analyze charts, manage risk, and build profitable habits… without needing to touch a single finance textbook.

Diamond Bottom
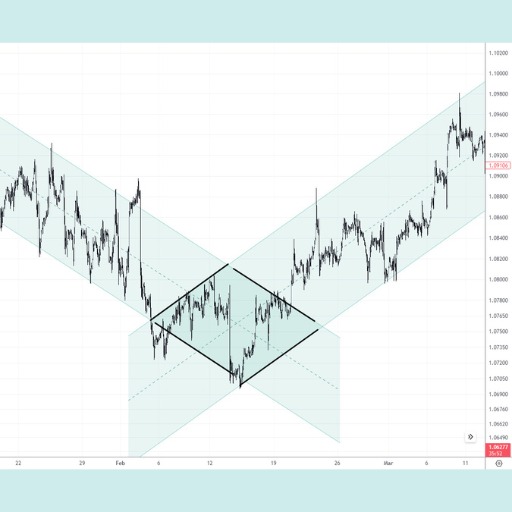
A Diamond Bottom is a bullish reversal chart pattern, occurring at the end of a downtrend. It signals a potential shift from selling pressure to buying control, resembling a diamond shape on the chart.
What to Look For:
- Prior Downtrend: The pattern must form after a clear downtrend.
- Expanding Phase: Initially, price swings widen, forming lower lows and higher highs (like a broadening formation). This shows increasing volatility and indecision.
- Contracting Phase: Following the expansion, price swings narrow, forming higher lows and lower highs (like a symmetrical triangle). This indicates a reduction in volatility.
- Diamond Shape: The combination of expanding then contracting price action creates the distinct diamond outline when trendlines are drawn.
- Breakout Above Resistance: The pattern is confirmed when the price breaks decisively above the upper trendline of the diamond with increased volume.
- Bullish Reversal: This breakout signals that the downtrend is likely over and a new uptrend is beginning.
- Volume Confirmation: Volume often decreases during the diamond's formation, but it should increase significantly during the breakout.
- Measured Move: The potential upward price target can be estimated by measuring the widest part of the diamond and projecting that distance from the breakout point.

It’s Monday.
New week. New charts. New chances.
But some are still dragging last week’s losses into today like it’s emotional luggage. Still replaying that one bad trade.
till flinching at every setup. Still hesitating, not from logic - but from fear.

Let’s be clear:
- One bad trade doesn’t ruin a trader.
- One red day doesn’t rewrite your strategy.
- One mistake doesn’t define your future.
The problem isn’t the loss—it’s the refusal to reset.
You’re not here to trade scared.You’re here to trade smart.
So take a breath.Recenter your mind.Get back to your process.
Ask yourself:
Are you still haunted by the last loss?
Or are you ready to show up like it never happened?
This market rewards clarity.
Not fear.
Not regret.
Just clean execution.
📌 The last trade is done.
This next one?
That’s where your focus should be.