
SpaceX Stock Coming
....................................................................................................................


Good morning,
Midweek momentum is back on Wall Street.
Nasdaq futures are charging ahead this Wednesday, pulling the broader market higher as investors step into one of the most consequential sessions of the week.
With stocks already sitting near record territory, all eyes are locked on two forces that can move markets fast: the Federal Reserve’s first policy decision of the year and earnings from Big Tech’s heavyweights.
The Fed is expected to hold rates steady, but the real market mover will be Chair Jerome Powell’s tone — especially with rate-cut expectations already being debated and political pressure swirling around the central bank.
At the same time, earnings season hits a critical gear. Microsoft, Meta, and Tesla report after the bell, with Apple up next, setting the stage for tech to either justify the rally or test investor confidence.
It’s a classic Wednesday setup: momentum building, nerves quietly humming, and catalysts stacked back-to-back.
By the closing bell, the market may have a much clearer sense of whether this rally has fresh legs — or if caution is about to creep back in.

📊 U.S. Futures Edge Higher Ahead of Fed Decision as Magnificent Seven Earnings Begin
Stock futures ticked up as investors braced for the Fed’s first policy decision of the year and the opening wave of Big Tech earnings, with Nvidia, Meta, Microsoft and Tesla firmly in focus.
🤖 Big Tech Earnings Set to Stress-Test AI Rally Amid $500B Spending Surge
Alphabet, Amazon, Microsoft and Meta face heightened scrutiny as AI investment is set to exceed $500 billion this year, forcing companies to prove returns after massive capital outlays.
🥇 Gold Blasts Above $5,280 as Dollar Slides After Trump Comments
Gold extended its historic rally to fresh record highs above $5,280 an ounce, fueled by dollar weakness and investor flight from sovereign currencies and bonds
🚀 SpaceX Eyes June 2026 IPO at $1.5 Trillion Valuation, Report Says
Elon Musk’s SpaceX is weighing a mid-2026 IPO that could raise up to $50 billion, potentially making it one of the largest public listings in history.
🪙 Bitcoin Beats Gold as Traders’ Top Safe Haven Despite Bullion Records
Bitcoin overtook gold as traders’ preferred volatility hedge in a Stocktwits poll, capturing 30% of votes even as gold trades at all-time highs.
🚗 Tesla Earnings in Focus as Wall Street, Retail Split on Q4 Upside
Tesla heads into Q4 earnings with investors divided on whether margins, deliveries and AI ambitions can reignite momentum in the stock.
💵 Dollar Hovers Near 4-Year Low as Trump Downplays Weakness Ahead of Fed
The U.S. dollar remained under pressure near four-year lows after President Trump dismissed concerns over its slide, sending the euro above $1.20 and lifting sterling to its strongest level since 2021.

If Trading Didn’t Work, Markets Wouldn’t Exist
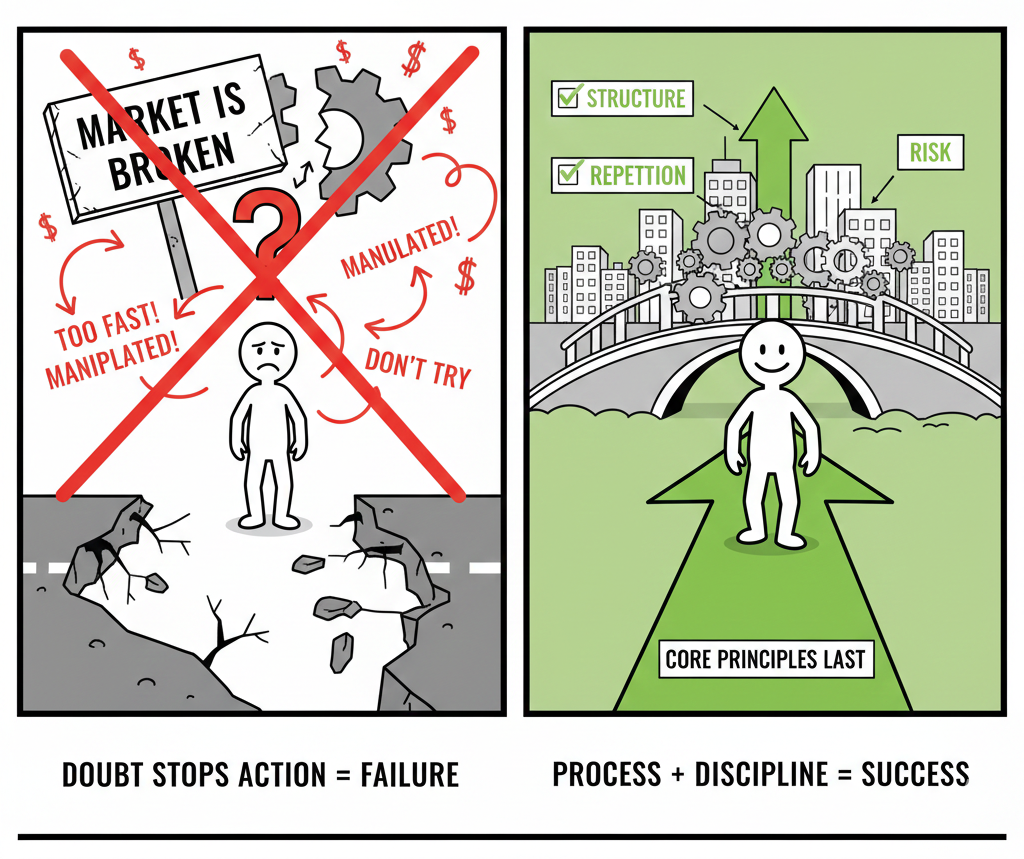
Every generation believes the market is broken. Too fast. Too manipulated. Too different from before. That belief usually appears right before someone decides not to try.
Markets exist because trading works. Not for everyone. Not instantly. But consistently for those who understand structure, risk, and repetition. Tools change. Speed changes. Access improves. The core principles stay the same.
What stops working is guessing, shortcuts, and impatience. When expectations reset, results follow. The market did not disappear. It still rewards preparation and discipline.
If you want guidance that focuses on timeless trading principles instead of hype or fear, these newsletters help. They break down how disciplined traders adapt without chasing trends.

Bearish Harami
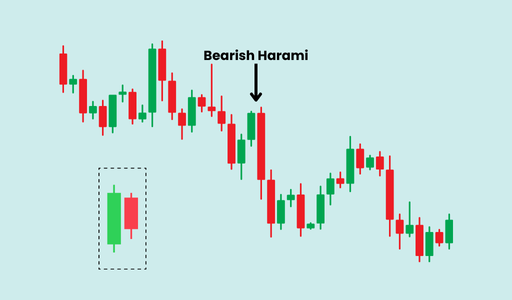
The Bearish Harami is a two-candle reversal pattern that signals a sudden "stall" in bullish momentum. It is the opposite of the Bullish Harami, appearing at the top of an uptrend.
The pattern consists of a large "mother" green candle followed by a small "baby" red candle that is completely tucked inside the first candle's body. It represents a moment where buyers have lost their edge and sellers are beginning to probe the market.
🛠️ The Strategy Logic
Use these logical triggers to identify when an uptrend is exhausted and a downward correction is likely:
- IF: The second (red) candle’s body is completely contained within the first (green) candle’s body...
- THEN: The pattern is valid. This shows that the market was unable to maintain its upward trajectory and has contracted into a state of indecision.
- IF: The Bearish Harami forms after a steep rally or at a major resistance level...
- THEN: The signal is high-probability. This suggests the market has hit a "ceiling" and the bulls are no longer willing or able to pay higher prices.
- THEN: The signal is high-probability. This suggests the market has hit a "ceiling" and the bulls are no longer willing or able to pay higher prices.
- IF: The second candle is a "Doji" (a tiny body with almost no height)...
- THEN: This is a Bearish Harami Cross. It is a more potent signal than a standard Harami because it represents total stalemate at the top of a trend, often leading to a more aggressive reversal.
- THEN: This is a Bearish Harami Cross. It is a more potent signal than a standard Harami because it represents total stalemate at the top of a trend, often leading to a more aggressive reversal.
- IF: The price breaks and closes below the low of the first (large green) candle...
- THEN: The bearish reversal is confirmed. This breakdown of the "mother" candle's base is the signal that sellers have officially taken control.
- THEN: The bearish reversal is confirmed. This breakdown of the "mother" candle's base is the signal that sellers have officially taken control.
- IF: The pattern is accompanied by an Overbought signal in the MFI or a drop in the Volume Oscillator...
- THEN: You have a "weakness" setup. The candles show the stall, and the indicators confirm that the buying "fuel" has been exhausted.
💡 Pro Tip
The "Inside Bar" Reality Check: Just like its bullish counterpart, a Bearish Harami is an "Inside Bar" setup. It signifies low volatility and consolidation. Many traders make the mistake of shorting immediately; however, the pattern can sometimes result in a "bull flag" if the trend is very strong. Always wait for the break of the mother candle's low to ensure the bears have actually won the tug-of-war before entering a short position.

When Risk Stops Feeling Real
Recent wins have a quiet side effect. They shrink your sense of danger.
After a few good trades, risk turns abstract. Stops feel far away.
Drawdowns feel unlikely.
You still know losses exist, but they live on paper, not in your body. Your mind focuses on what you have been making, not what you could lose.
That is risk blindness.
Position size creeps up. Entries get faster. You stop asking what happens if this fails.
You start assuming it will work because the last ones did.
The market does not correct this gently.
It waits until you are comfortable. Then it reminds you that downside is not a concept. It is a number. A real one. One that hits faster and harder than expected.
Strong traders force risk back into focus even during winning streaks.
They calculate worst-case outcomes.
They respect their stops.
They trade as if the next loss is always possible.
Wins are useful. They build confidence. But when they make risk feel imaginary, they set the trap.
The goal is not to feel fearless.
The goal is to stay aware.


