Soundhood Keeps Climbing
....................................................................................................................


Happy Wednesday traders,
Wall Street’s red-hot streak finally cooled, but futures are inching back into the green this morning.
Dow, S&P 500, and Nasdaq contracts are up about 0.2% after Tuesday’s pullback, when Powell’s Rhode Island speech put traders on edge.
He warned that low employment and sticky inflation leave “no risk-free path” ahead, while hinting that more cuts could come but not without caution.
Markets are digesting that message today, balancing record highs with Powell’s warning that stocks are “fairly highly valued.”
As always, the crucial updates below break down the big movers and the setups traders are watching.

⛔ Wall Street Futures Stall After Record Run
Stocks capped a third straight record close, fueled by Nvidia’s $100B OpenAI bet and Tesla’s surge. But futures are treading water ahead of Powell’s speech and fresh inflation data.
🤝 Nvidia’s $100B OpenAI Deal Ignites Market Rally
The chipmaker’s megabet on AI sent its stock up 5% and dragged the S&P 500 to fresh highs. Wall Street just got a reminder that the AI boom is far from cooling off.
🚗 Tesla Hits 2025 High as Musk Fuels the Momentum
Shares closed at $434 after a 9-out-of-10 winning streak, boosted by Musk’s billion-dollar buy and Robotaxi hype. Wall Street’s bullish calls suggest the run may be just getting started.
🪙 Bitcoin Tests $112K as Exchange Inflows Surge Liquidations top $1.6B with long positions wiped out. Elevated inflows hint at more selling pressure unless outflows return to signal accumulation.
📈 Asian Markets Split After Wall Street’s Record Run
Tokyo sat out, Hong Kong stumbled, and Shanghai slipped while Australia and Korea held gains. With Wall Street on a record streak, Asia is waiting for its next big catalyst.
🆙 Retail Mania Lifts SoundHound Above $17
A 23% run in two weeks has SOUN at its best level since January. Traders on Stocktwits call for a cup-and-handle breakout toward $20+.
🧈 Gold Climbs to Fresh Record as Fed Path Drives Demand
With ETF inflows rising and rate cuts looming, safe-haven buyers push bullion higher. Powell’s comments today could set the next leg.

No stocks for today.
The market is in waiting mode and so are we.
Capital preservation is just as important as profit.
We stay patient and wait for the next high-probability setup.

Trading Isn’t About Impressing Anyone
Most people hesitate to start trading because they’re worried about looking foolish.
They imagine friends, family, or coworkers asking how it’s going, and the thought of admitting a loss feels embarrassing.
But here’s the truth: nobody else is living with your wins or your losses. They don’t see the hours you put in, the lessons you learn, or the quiet progress you’re making.
Trading isn’t a performance. It’s a skill you build for yourself.
The market doesn’t hand out applause or criticism.
It just responds to how prepared you are. Once you stop trading for validation and start trading for growth, fear of embarrassment loses its power.
If you’ve been holding back because of what others might think, let that go. This journey is yours.
👉 Want to trade with more confidence and clarity?
Subscribe to our collection of trading newsletters and get strategies that focus on growth, not ego.

Vortex Indicator
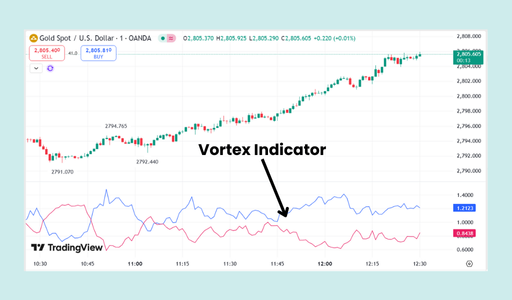
What to Look For
- Two Oscillating Lines: The indicator consists of two main lines:
- VI+ (Positive Vortex Indicator): Represents the strength of the bullish trend.
- VI- (Negative Vortex Indicator): Represents the strength of the bearish trend.
- Trend Identification: The relationship between the two lines is the key signal.
- When the VI+ is above the VI-, it indicates a strong uptrend.
- When the VI- is above the VI+, it indicates a strong downtrend.
- Crossovers (Key Signal): The most significant signal is when the two lines cross.
- Bullish Crossover: A potential buy signal occurs when the VI+ line crosses above the VI- line. This suggests that a new uptrend may be starting.
- Bearish Crossover: A potential sell signal occurs when the VI- line crosses above the VI+ line. This suggests that a new downtrend may be starting.
- Trend Strength: The farther the two lines move apart after a crossover, the stronger the trend. Conversely, when the lines move closer together and cross frequently, it suggests a weakening trend or a sideways market.
- Use with Other Indicators: The Vortex Indicator works best in trending markets and can generate false signals in choppy or ranging markets. For this reason, it is often used with other indicators like moving averages to confirm signals and filter out noise.

Some traders walk into the market carrying more than charts.
They’re carrying expectations, family hopes, unpaid bills, and the weight of being “the one who must make it.”
That pressure shows up in the way they click. Entries get rushed.
Stops get ignored. Setups get forced.
But here’s the harsh reality: the market doesn’t bend to personal stories.
It doesn’t care if this is your last dollar or your “must-win” week.
Trading from a place of desperation only guarantees one outcome - more desperation.
The edge isn’t built on pressure.
It’s built on patience. A clear head sees levels better than a heavy heart ever will.
If the weight is too much, step back. Reset.
Come back when you’re ready to trade your plan, not your emotions.
Because the market will always punish panic, but it quietly rewards discipline.