
SoftBank Dumps Nvidia Stake
....................................................................................................................


Good morning!
Wall Street’s looking cautiously optimistic this morning. US stock futures crept higher Wednesday, with investors rotating out of Big Tech and into safer corners of the market while keeping one eye glued to Washington. A key House vote later today could finally bring an end to the longest government shutdown in US history.
Dow futures added 0.1%, following the blue-chip index’s record close on Tuesday. The S&P 500 ticked up 0.3%, and the Nasdaq 100 climbed 0.6%, hinting that investors aren’t ready to abandon tech completely, just catching their breath after weeks of frothy AI rallies.
In a surprising twist, SoftBank sold its entire Nvidia stake, pocketing roughly $5.8B.
It’s a bold move and maybe a signal. While everyone’s still chasing the AI chip frenzy, SoftBank is rotating into the next phase of AI infrastructure.
The tone across markets feels like one of measured optimism: political gridlock might be easing, the Fed’s next move is in focus, and traders are rebalancing portfolios as Big Tech cools off.

🪙 Gold Stocks Rally as Shutdown Deal Clears Senate
With the U.S. Senate passing a funding deal and moving to end the nation’s longest shutdown, gold jumped nearly 3% to above US $4,100/oz and stocks rallied - investors are breathing a bit easier.
🏦 UBS Sees S&P 500 at 7,500 by End-2026
UBS raised its target for the S&P 500 to 7,500 by end-2026, citing a 14% earnings growth boost and AI-capex driving the next leg of the bull market.
🎮 Sony Lifts Profit Forecast 8%
Sony raised its operating profit forecast by 8% to about ¥1.43 trillion (~US $9.5 billion) thanks to strong performance in its chips and entertainment units.
📊 SoftBank’s Profit More Than Doubles
SoftBank Group posted a net profit of approximately ¥3.5 trillion (~US $16.6 billion) - more than twice last year - boosted by AI stakes and major investor gains.
💰 SoftBank Sells Entire Nvidia Stake for $5.8B
SoftBank offloaded its full stake in Nvidia, raising US $5.8 billion, a move that signals a pivot toward other AI investments and spurred fresh questions about the heat in the chip rally.
↕️ Bitcoin Hovers Near US$105K Amid Shutdown Optimism
With hopes mounting for a U.S. government reopening, bitcoin lingered around US $105,000, while retail traders kept an eye on its next directional cue as macro risk eases.
📈 XPeng Stock Soars to Best Day in 2+ Years
XPeng Inc. shares jumped after analysts upgraded expectations for a profit in Q3 - October deliveries hit 42,013 vehicles and gross margin improved to 17.3%. Retail traders are calling it “ahead of Tesla.

SPX Technologies (NYSE: SPXC) - TP Hit
Remember I posted up a high winning probability stock yesterday?
And just like that - one day.
That’s all it took for this setup to deliver.
We spotted this high-probability reversal right as it touched the zone.
Red arrows appeared.
RSI crossed down.
Momentum cracked - and price slid straight into our target.
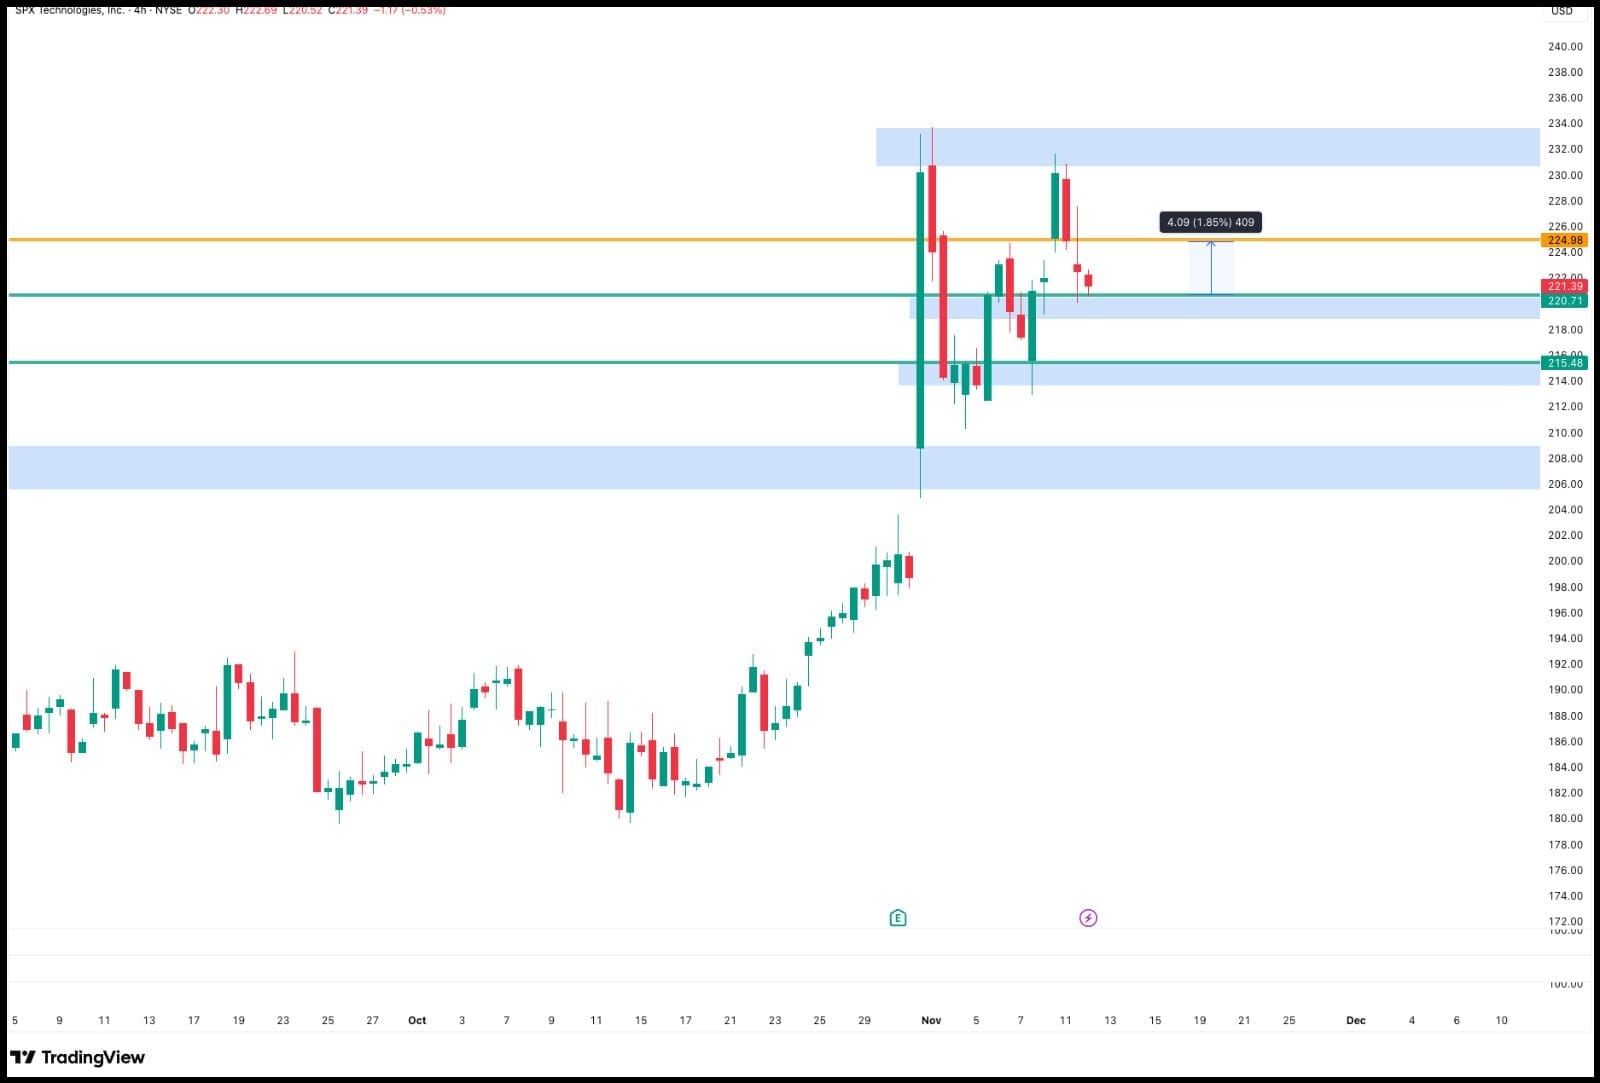
Gain of 1.85% before leverage.
This is exactly why we’ve been refining our entries.
So that when we pull the trigger, it lands fast and clean.
The sniper work is paying off. 🔥
Recommendation - Molina Healthcare (NYSE: MOH)
After a long drop in MOH, price landed in our major support zone.
And the signs of exhaustion are obviously kicking in.
We’ve got a green arrow flashing.
RSI is crossing up from oversold.
And price is sitting out of the band - potential for a strong rebound.
Buy at $143.44
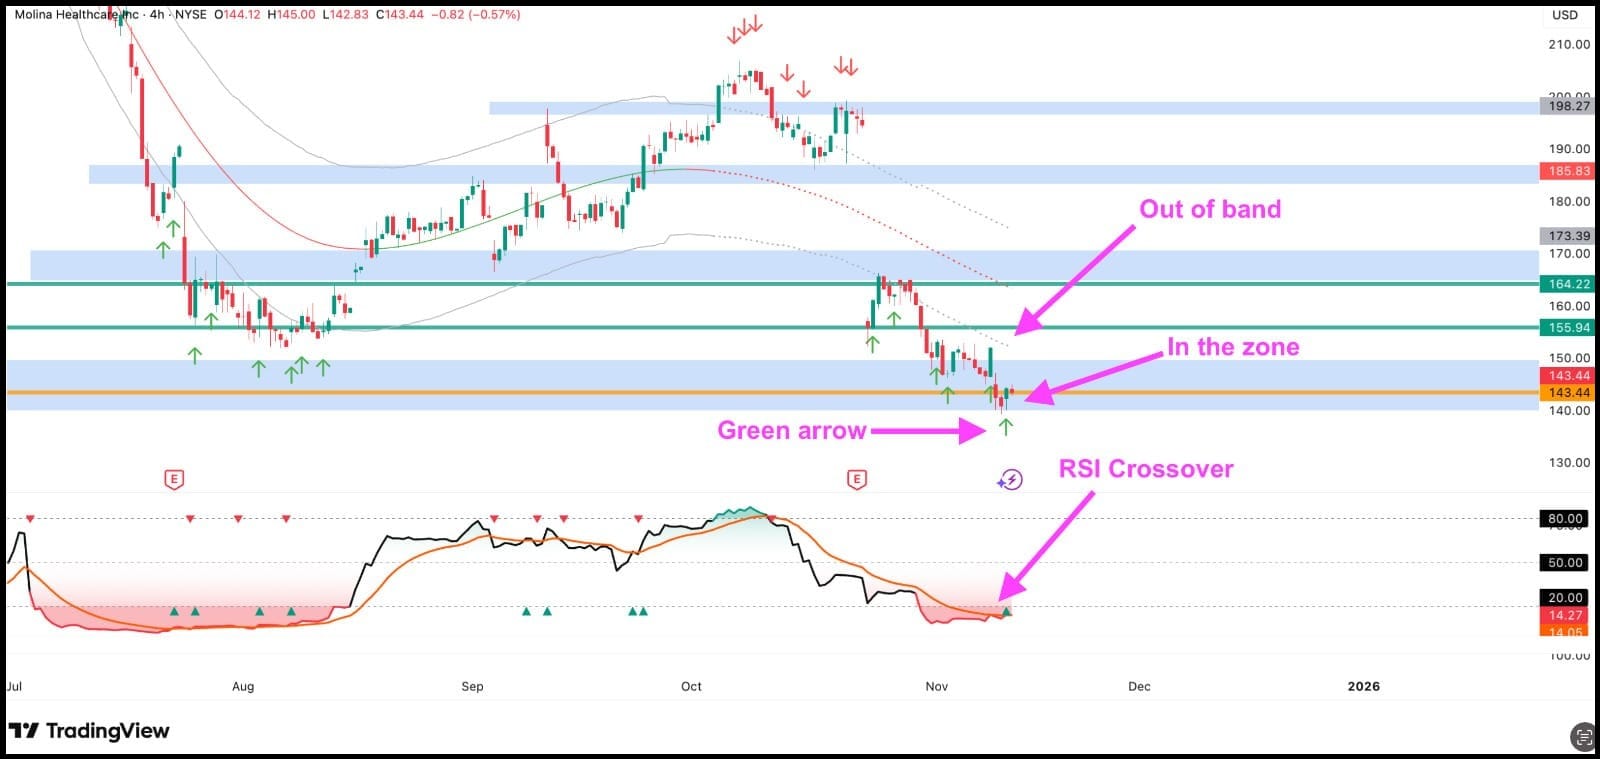
🎯 Targets:
Buy: $143.44
TP1: $155.94
TP2: $164.22
Patience here could pay big.
The structure looks ready.
And once it breaks momentum, we’ll ride the wave up.
Update you soon!
Prime Medicine (NASDAQ: PRME)
Some charts whisper.
This one shouted.
After weeks of steady decline, Prime Medicine just touched a key reversal zone.
A green arrow flashed right at the bottom.
RSI crossed up.
Momentum is shifting quietly, but when this turns, it could move fast.
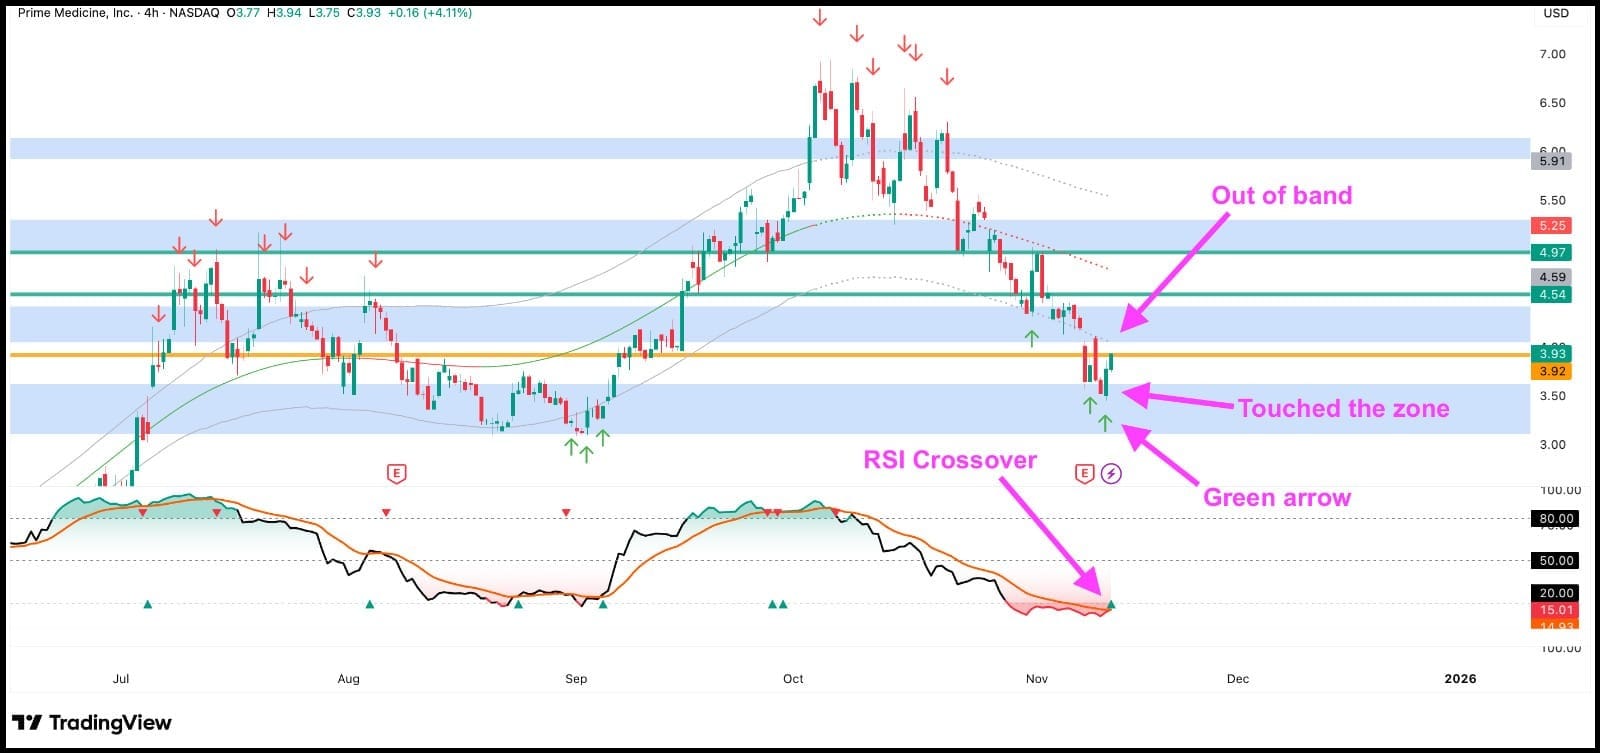
🎯 Targets:
Buy: $3.92
TP1: $4.54
TP2: $4.97
This setup looks primed for a bounce.
Just like the name says.

Learn the Four Market Phases and Stop Guessing.
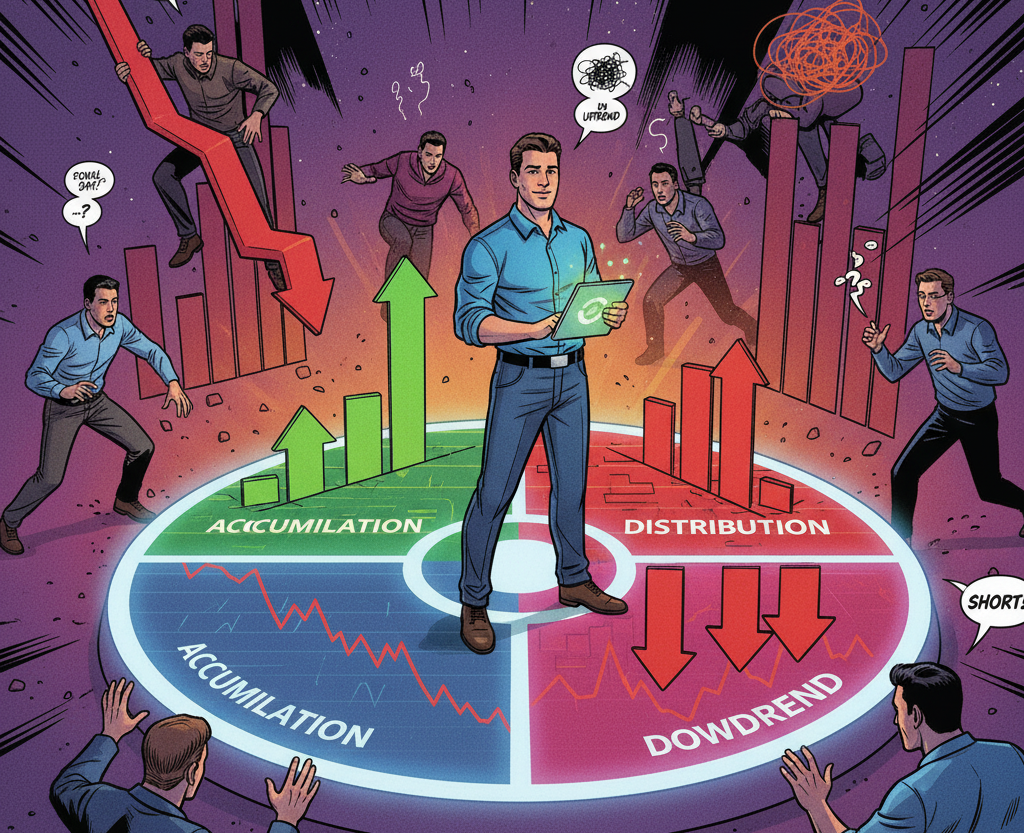
Most traders freeze because they don’t know what kind of market they’re in. They chase breakouts during distribution or short pullbacks in accumulation. That’s not strategy - it’s confusion.
Every market runs through four phases: accumulation, uptrend, distribution, and downtrend. Each phase has a rhythm. When you know where you are, you stop reacting and start planning. You take trades that fit the cycle instead of fighting it.
Guessing ends when you understand market context. You don’t need to predict the next move - you need to recognize the environment you’re trading in.
If you want to trade with confidence instead of confusion, these newsletters will help. They teach how to read market phases, spot turning points, and align your trades with the trend, not against it.

Volume Weighted Average Price (VWAP)
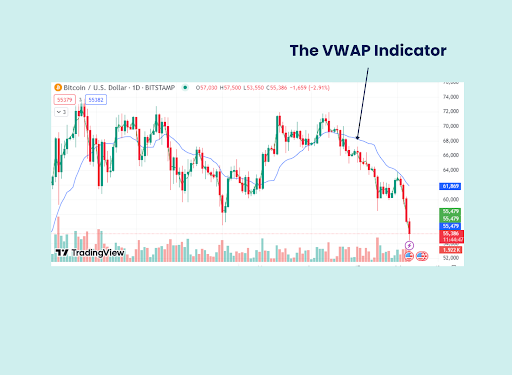
The Volume Weighted Average Price (VWAP) is a powerful benchmark technical indicator that represents the average price of a security adjusted for its trading volume over a specific time period (typically one trading day). It gives more weight to price points where a larger volume of shares was traded.
VWAP is a crucial tool for institutional traders, large funds, and high-frequency traders, as it helps determine whether they received a "good" price for their trades relative to the day's total activity. It is viewed as the true average price of the day.
What to Look For (Key Features and Signals)
The VWAP is calculated by summing the dollar value of all shares traded (Price × Volume) and dividing it by the total volume traded for that period.
- Benchmark/Fair Value: The VWAP line itself is considered the day's true average price or fair value.
- Bullish Signal: If the price is consistently trading above the VWAP line, it suggests that the majority of the day's volume was transacted below the current price, indicating bullish strength.
- Bearish Signal: If the price is consistently trading below the VWAP line, it suggests that the majority of the day's volume was transacted above the current price, indicating bearish weakness.
- Institutional Trading Filter: Large institutional traders often use VWAP as a filter. They aim to buy below the VWAP and sell above the VWAP to demonstrate that they executed their orders at favorable prices relative to the rest of the market's activity.
- Dynamic Support and Resistance: The VWAP line frequently acts as a dynamic level of support or resistance for intraday price action.
- In a strong uptrend, the price will often pull back to and bounce off the VWAP line.
- In a strong downtrend, the price will often rally up to and be rejected by the VWAP line.
- Limitations (Intraday Tool): The VWAP is an intraday indicator and resets every day. Because its calculation relies on a cumulative measure, it tends to lag price action significantly toward the end of the day. It is not meant to be used for multi-day analysis.

Patience Isn’t Passive
Most traders confuse patience with doing nothing.
They think sitting on their hands means wasting time.
It doesn’t.
Patience is one of the most active decisions you’ll ever make in trading.
Every time you choose to wait, you’re doing real work.
You’re controlling impulse, filtering noise, and giving your setup time to form.
You’re protecting your capital from random bets and emotional entries.
That’s not laziness - that’s discipline in action.
The best traders aren’t the ones who trade the most.
They’re the ones who know when not to trade.
They can sit through the chop, ignore the fake moves, and strike only when their edge appears.

Patience doesn’t mean idleness. It means deliberate inaction with purpose behind it.
Waiting is a skill and in trading, it’s one of the hardest skills to master.


