SciSparc Moonshot 61%
....................................................................................................................


Good morning!
US stock futures are in the green this morning, but the vibe is far from calm.
With a possible government shutdown looming by midweek, traders are hedging bets while watching every headline.
Dow and S&P 500 futures ticked up ~0.4%, while the Nasdaq popped 0.5%.
But here’s the catch: if the shutdown hits, key data like Friday’s jobs report could be delayed.
That would leave the Fed flying blind and rate-cut bets wobbling.
A Monday meeting between Trump and congressional leaders is shaping up as the market’s “last hope” to avoid the chaos.
Now, let’s dive into the stories shaking screens today 👇

🧬 SciSparc Moonshot +61%
Traders piled in after the biotech dropped news of a quantum-computing play in 3D protein modeling. Bulls are eyeing $10 before the close.
💊 Trump Slaps 100% Pharma Tariff
Drugmakers now face a crushing levy unless they’re building U.S. factories. Traders brace for biotech and healthcare chaos.
📉 Oracle Hit with Downgrade
Shares slipped after Rothschild said investors are “materially overestimating” cloud contracts. Bulls still calling dip a gift.
🪙 Bull Run Gets Shaky
Markets climbed 33% since April, but valuations are stretched thin—one hiccup could sting.
🐋 Whales Grab $1.2B ETH
Eleven mega-wallets scooped up nearly 296k ETH while the market was drowning in liquidations.
💥 BTC Crumbles Below $109K
Bitcoin slid to a two-week low, with Asia selling pressure dragging it toward $108K. Despite the dump, spot buyers are scooping lows, stacking sats while leverage bleeds.
🌏 Asia Stocks Tank on New Tariffs
Markets slipped as Trump’s new tariffs on drugs, furniture, and trucks rattled investors overnight.

I’m spending time these few weeks fine-tuning our game plan.
The goal is simple: Even more laser-targeted wins for our stock recommendations.
This is the quiet work that makes the loud results possible.
No setups yet, but the watchlist is heating up.
Expect a fresh alert very soon.

When You Treat Trading Like Gambling, It Becomes Gambling
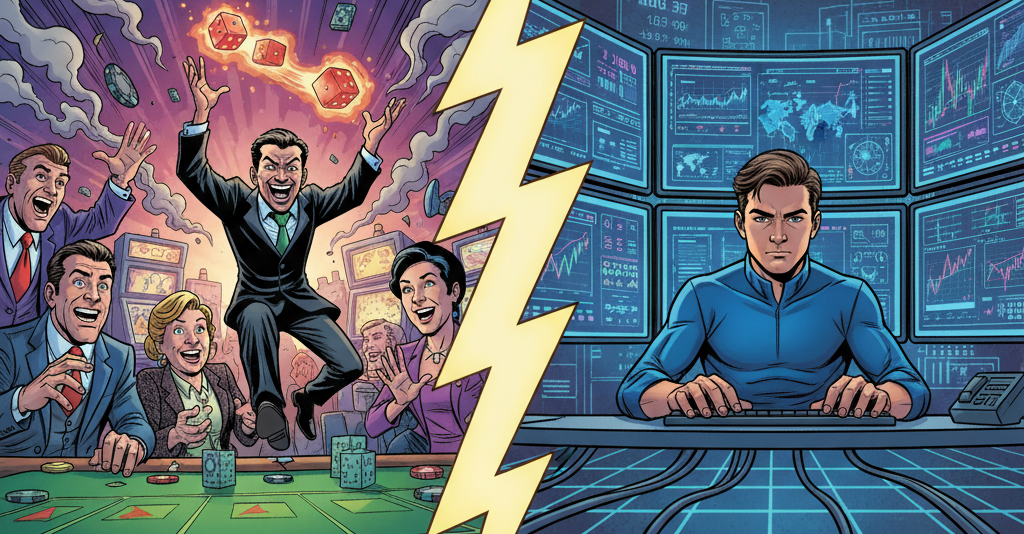
The market only feels like a casino when you walk in blind.
Gamblers toss chips and hope for luck. Traders work with probabilities, risk control, and discipline. That’s the difference.
If you treat every trade like a roll of the dice, don’t be surprised when the outcome looks like Vegas.
But when you slow down, learn the rules, and manage risk, the game changes. It’s no longer luck - it’s strategy.
Don’t hand your future to chance. Start building skills.
👉 Subscribe to a trading newsletters that cuts through the noise and gives you real, usable insights.

Moving Average Convergence Divergence (MACD)
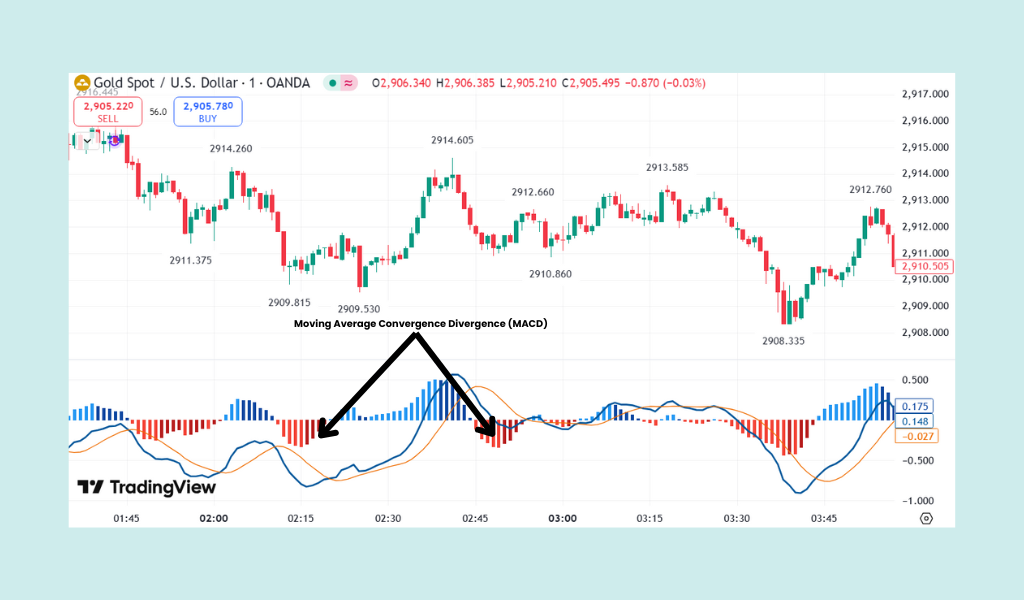
The Moving Average Convergence Divergence (MACD) is a versatile and popular technical indicator that helps traders spot changes in a trend's direction, momentum, and strength. Developed by Gerald Appel, it's an oscillator that combines two different moving averages to give you a clearer picture of market dynamics.
It's displayed below the price chart and has three main parts that move around a Zero Line:
- MACD Line: The faster line; it's the difference between a 12-period and 26-period Exponential Moving Average (EMA).
- Signal Line: The slower line; it's a 9-period EMA of the MACD Line itself, used to trigger buy/sell signals.
- Histogram: The vertical bars that plot the difference between the MACD Line and the Signal Line.
What to Look For
The MACD provides three primary types of signals:
1. Line Crossovers (Trade Signals)
This is the most common way to generate a buy or sell signal.
- Bullish Crossover (Buy Signal): The MACD Line crosses above the Signal Line. This suggests that bullish momentum is increasing.
- Bearish Crossover (Sell Signal): The MACD Line crosses below the Signal Line. This suggests that bearish momentum is increasing.
2. Zero Line Crossovers (Trend Confirmation)
The Zero Line acts as a baseline, showing whether the short-term EMA is above or below the long-term EMA.
- Bullish Trend Confirmed: The MACD Line is above the Zero Line. This means the short-term average is greater than the long-term average, indicating an overall uptrend.
- Bearish Trend Confirmed: The MACD Line is below the Zero Line. This means the short-term average is less than the long-term average, indicating an overall downtrend.
- Zero Line Cross: When the MACD Line crosses the Zero Line, it signals a broad shift in the market's overall trend direction.
3. Divergence (Warning of a Reversal)
Divergence occurs when the price of the asset and the MACD indicator are moving in opposite directions, often signaling that the current trend is about to reverse.
- Bullish Divergence: The asset's price makes a lower low, but the MACD makes a higher low. This suggests that the selling pressure is weakening, and a reversal to the upside is possible.
- Bearish Divergence: The asset's price makes a higher high, but the MACD makes a lower high. This suggests that the buying pressure is weakening, and a reversal to the downside is possible.
4. Histogram Momentum
The height of the histogram bars shows the strength of the momentum.
- Increasing Momentum: The histogram bars get taller (moving away from the Zero Line), indicating the trend is accelerating.
- Decreasing Momentum: The histogram bars get shorter (moving toward the Zero Line), indicating the trend is slowing down and a crossover might be near.

🦅 Trade Like an Eagle, Not a Sparrow
Picture an eagle high above the mountains.
From that height, it sees everything - the rivers winding below, the forests swaying in the wind, and even the faintest movement of prey in the grass.

But notice something: it doesn’t dive at every shadow, every rustle, or every tempting flicker.
The eagle waits.
Patient. Still. Calculated.
Because it knows one truth - if it wastes energy chasing noise, it starves.
But if it conserves its power, sharpens its focus, and waits for the perfect opportunity, the strike is quick, decisive, and rewarding.
Trading works the same way.
Not every chart pattern deserves your money. Not every green candle deserves your entry.
Most moves are distractions that drain your account and your mindset.
The real edge is in patience - the discipline to watch, wait, and act only when the opportunity is strong enough to justify the risk.
The market rewards the trader who thinks like an eagle.
See everything.
Ignore most of it.
Strike only when it matters.