Santa Rally Countdown
....................................................................................................................


Christmas Eve, and Wall Street is showing up in a good mood.
U.S. stock futures are steady this Wednesday after the S&P 500 punched out another record, setting the tone for a shortened holiday session that feels more celebratory than cautious.
With markets closing early today and dark tomorrow, traders are less interested in forcing big bets and more focused on protecting a strong run into year-end.
The setup has all the ingredients of a classic Santa-week tape: lighter volume, narrower moves, and a market leaning on momentum rather than fresh conviction.
Tech has carried the lead into the holiday, while gold’s breakout to fresh highs is a reminder that rate-cut expectations and geopolitical risks are still quietly shaping the backdrop.
It’s a calm, reflective Christmas Eve session — less about chasing trades, more about riding the trend into the holidays with gains intact.

📈 S&P 500 Notches Record Close as Growth Names Lead
U.S. equities climbed as investors cheered fresh economic data, driving the S&P 500 to a new closing high while growth stocks powered the market higher ahead of year-end trading.
🇪🇺 European Markets Set for Soft Open; STOXX 600, DAX, CAC 40 in Focus
European equities were poised to start modestly after recent gains, with major indices like the STOXX 600, DAX and CAC 40 responding to thin holiday volumes and cautious sentiment in the run-up to Christmas trading.
🟠Copper Poised for Best Year Since 2009 After December Surge
Copper prices surged on heavy investor interest and supply pressures, putting the industrial metal on track for its strongest annual performance since 2009 as markets digest tariff-related positioning and tightening fundamentals.
🥇 Gold Climbs Above $4,500 in Historic Precious Metals Rally
Gold continued its breakout, rising above $4,500 an ounce as silver and platinum also reached record levels, fueled by demand for safe havens and expectations of future central bank rate cuts.
🌏 Asian Markets Mostly Advance After Wall Street Records
Asian equities largely climbed as markets reacted to another record close on Wall Street, with investors balancing U.S. economic resilience against thin holiday trading and mixed regional performance.
👟 Nike Stock Pops After Hours as Apple’s Tim Cook Buys Nearly $3M in Shares
Nike shares jumped in after-hours trading following a disclosed insider purchase by Apple board member Tim Cook — a move seen by some investors as a show of confidence amid the company’s broader turnaround efforts.
🛢️ BP to Sell 65% Stake in Castrol
BP agreed to sell a majority 65% stake in its Castrol lubricants business to Stonepeak in a deal that values the unit at roughly $10 billion, generating about $6 billion in proceeds that will help cut debt and sharpen the company’s strategic focus.

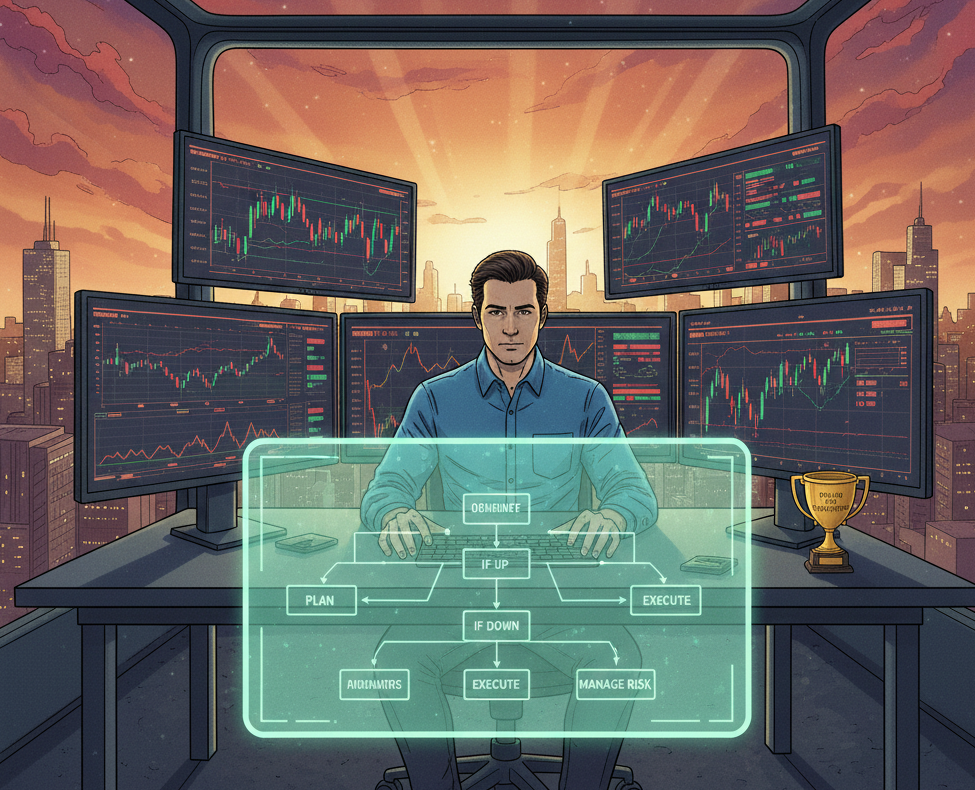
Markets Don’t Promise. They Reward Preparation
Markets make people uncomfortable because nothing is guaranteed. There is no certificate, no fixed outcome, no safety net.
That uncertainty pushes many people away before they even begin.
They assume that if results are not promised, the effort is not worth it.
But trading is not about certainty. It is about probability, structure, and response. Prepared traders are not guessing.
They know what they will do if price moves up, down, or nowhere at all. That preparation removes panic. It replaces hope with process.
When you accept uncertainty and plan around it, trading becomes calmer. You stop chasing guarantees and start building consistency.
The market does not reward confidence. It rewards readiness.
If you want help learning how to prepare instead of predict, these newsletters break down how experienced traders think, plan, and manage uncertainty. They focus on process, not promises.

Donchian Channels
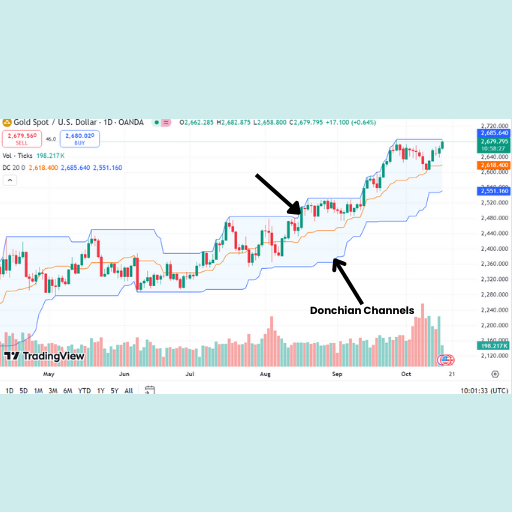
Donchian Channels are a volatility-based technical indicator developed by Richard Donchian, a pioneer of trend-following strategies. This indicator is primarily used to identify trend breakouts and gauge market volatility. It consists of three lines that form a "channel" around the price action.
Unlike Bollinger Bands, which use standard deviation, Donchian Channels are based entirely on the absolute price extremes (highest highs and lowest lows) over a set period. This makes it a straightforward tool for identifying when the market has reached a new multi-period peak or trough.
What to Look For (Key Features and Signals)
The indicator typically uses a 20-period look-back (the average number of trading days in a month), but this can be adjusted for different timeframes.
- The Three Components:
- Upper Band: This represents the Highest High over the last N periods. It acts as a dynamic resistance level.
- Lower Band: This represents the Lowest Low over the last N periods. It acts as a dynamic support level.
- Middle Line: This is the average of the Upper and Lower bands (Upper plus Lower, divided by 2). It represents the median price or "mean" of the range.
- Breakout Signals (The Primary Use): Donchian Channels are most famous for their "Turtle Trading" breakout signals.
- Bullish Breakout: A buy signal is generated when the price touches or closes above the Upper Band. This indicates a new multi-period high and the potential start of an uptrend.
- Bearish Breakdown: A sell signal is generated when the price touches or closes below the Lower Band. This indicates a new multi-period low and the potential start of a downtrend.
- Volatility Analysis: The width of the channel is a direct reflection of volatility.
- Narrow Channels: Indicate a period of low volatility or consolidation (a "squeeze"). This often precedes a significant breakout.
- Wide Channels: Indicate high volatility and a strong, active trend.
- Middle Line as Support/Resistance: In a strong trend, the Middle Line often acts as a dynamic level where pullbacks end.
- In an uptrend, price usually stays above the Middle Line. A dip to the Middle Line that holds can be a "buy the dip" opportunity.
- In a downtrend, price usually stays below the Middle Line.
- Stop-Loss Placement: Many traders use the opposite band or the Middle Line as a trailing stop-loss. For example, in a long trade, the stop-loss might be moved up along with the Lower Band.

The Confidence Cycle

Confidence in trading does not arrive in a rush.
It builds quietly, one clean decision at a time.
You follow your plan.
You manage risk.
You accept outcomes without drama.
Over time, something settles in. You stop forcing trades. You trust your reads. You execute without second-guessing. That is real confidence.
Then hesitation sneaks in.
You see your setup. You pause. You adjust. You wait for extra confirmation that never comes. The trade works without you.
That single moment does damage.
Not because you missed money, but because you broke the contract with yourself. Doubt replaces trust. The next setup feels heavier. Execution feels harder.
Confidence is fragile because it depends on self-belief, not PnL.
It survives on follow-through.
The way to protect it is simple and uncomfortable. When your rules align, you act. When they don’t, you stand down.
Confidence is not built by winning trades.
It is built by honoring your process, even when your hands shake.