"SaaSpocalypse" Hits Traders
....................................................................................................................


Good morning,
Wednesday opened on a cautious bounce.
US stock futures ticked higher as Wall Street looked past Tuesday’s tech-led bruising and toward a possible funding deal to end the partial US government shutdown.
Dow futures and S&P 500 futures were both up around 0.3%, while Nasdaq 100 futures edged 0.2% higher, steadying after AI worries sparked broad losses in the previous session.
But the damage from Tuesday is still fresh.
Traders fled software stocks amid an AI panic, dumping shares in what’s being dubbed the “SaaSpocalypse.” Fears that artificial intelligence could upend traditional software business models sparked a rush for the exits across the sector.
Technology stocks bore the brunt of the selling:
- Nvidia and Microsoft fell more than 2%
- AI-linked names like Broadcom, Oracle, and Micron followed lower
- The tech sector sank over 2% within the S&P 500
The pressure didn’t stop at the close.
After-hours trading extended the selloff:
- Chipotle plunged nearly 7% after reporting another quarter of declining customer traffic and warning same-store sales growth could stall in 2026
- AMD slid more than 7% as investors recoiled at its first-quarter outlook
Now the spotlight shifts to earnings.
Investors are bracing for Alphabet’s results later today, with Amazon reporting Thursday — numbers that could determine whether this week’s tech rout was a temporary shakeout… or the start of a deeper reset.
Today, the mood is clear: cautious bids, shaken tech confidence, and AI fear front and center.

📉 Dow & S&P Futures Steady Despite Tech Rout and Iran Tensions
Tech stocks dragged indexes lower, but U.S. futures edged up slightly as investors focus on upcoming Alphabet and Amazon earnings.
🥇 Gold Rebound above $5,000 Despite Historic Retreat
Gold steadied after last week’s record-breaking pullback, showing investors remain cautious yet interested in safe-haven assets.
💊 Novo Nordisk Shares Plunge on Steep Sales Forecast
Novo predicts sales could fall 13% this year amid a brutal price war in weight-loss drugs, rattling investor confidence.
🔍 Alphabet Q4 Earnings to Test AI-Driven Stock Rally
Wall Street eyes $111.4B revenue and $2.65 EPS as Google’s AI wins fuel optimism ahead of its post-market report.
🪙 Bitcoin-Led Crypto Rout Wipes Out Nearly $500B in a Week
Cryptocurrencies tumbled sharply, with Bitcoin hitting its lowest levels since Trump’s re-election in November 2024, erasing investor gains.
💻 Traders Flee Software Stocks Amid AI Panic
Wall Street dumps software shares in a frenzy dubbed the “SaaSpocalypse”, as fears of AI-driven disruption spike.
🎨 Figma Stock Drops Over 40% This Year, Retail Traders Call It a Steal
Figma shares slump amid broad software sell-off, but retail investors see opportunity in a bargain-priced tech play.

If Trading Worked in 3 Days, Everyone Would Be Rich
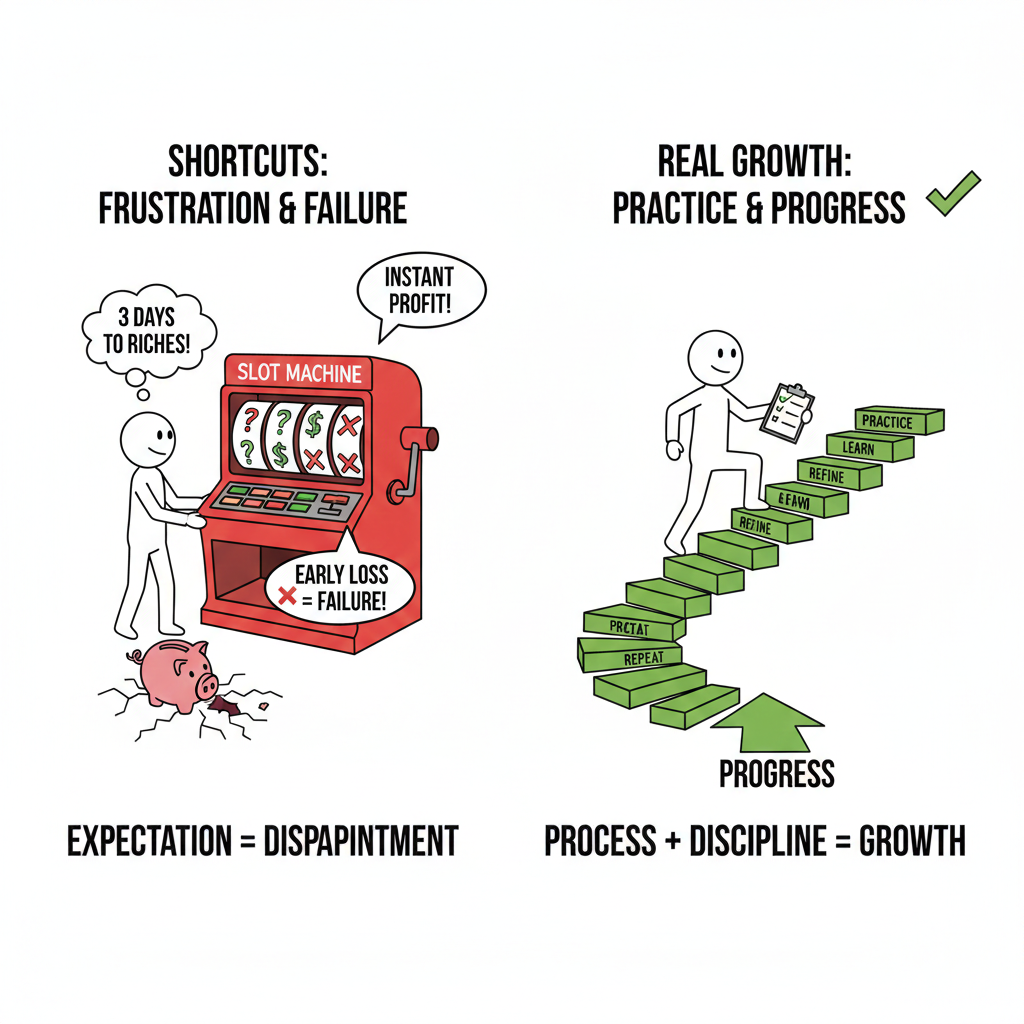
Trading doesn’t hand out instant results. The market tests patience first, skill second. Expecting profit after a few trades sets you up for frustration, not growth.
Strong traders know results come from repeated practice, learning from mistakes, and refining a plan. Early losses are data, not failure. Progress is built quietly, one decision at a time.
When you stop expecting shortcuts, trading stops feeling like a lottery. You focus on improving, not proving, and your edge grows steadily.
If you want guidance that helps you start with structure instead of waiting for perfection, these newsletters help. They focus on fundamentals, discipline, and steady improvement.

Gann Fan
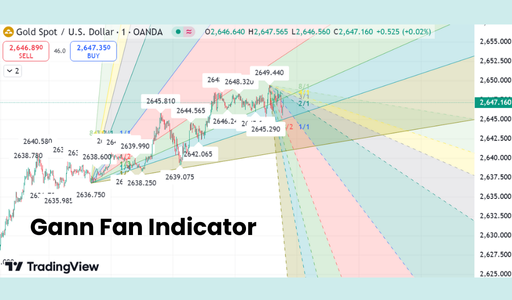
The Gann Fan is a technical analysis tool based on the theory of W.D. Gann, which proposes that prices move in predictable geometric angles. It consists of a series of lines drawn from a major high or low at specific angles. The most important is the 1x1 line (representing one unit of price for one unit of time), which acts as the ultimate balance between time and price.
🛠️ The Strategy Logic
Use these geometric triggers to identify hidden support, resistance, and the strength of a trend:
- IF: The price is trading above the 1x1 (45-degree) angle...
- THEN: The market is in a strong bullish phase. As long as the price stays above this line, the uptrend is considered sustainable and healthy.
- THEN: The market is in a strong bullish phase. As long as the price stays above this line, the uptrend is considered sustainable and healthy.
- IF: The price breaks below the 1x1 line...
- THEN: The dominant trend has weakened. This is often a signal that the market will drop to find support at the next lower angle (such as the 2x1 line). A break of the 1x1 is frequently the first warning of a major trend reversal.
- THEN: The dominant trend has weakened. This is often a signal that the market will drop to find support at the next lower angle (such as the 2x1 line). A break of the 1x1 is frequently the first warning of a major trend reversal.
- IF: The price is "hugging" the 1x8 or 1x4 lines (the steepest angles)...
- THEN: The market is in a parabolic or "overheated" state. While momentum is high, these moves are difficult to sustain; be prepared for a violent correction back toward the 1x1 "equilibrium" line.
- THEN: The market is in a parabolic or "overheated" state. While momentum is high, these moves are difficult to sustain; be prepared for a violent correction back toward the 1x1 "equilibrium" line.
- IF: The price hits a Gann angle and shows a reversal candlestick (like a Hammer or Shooting Star)...
- THEN: The angle is acting as active support or resistance. Gann lines often act as "diagonal" floors and ceilings that price will respect even when there is no horizontal support in sight.
- THEN: The angle is acting as active support or resistance. Gann lines often act as "diagonal" floors and ceilings that price will respect even when there is no horizontal support in sight.
- IF: Multiple Gann angles from different swing points intersect at a specific price and time...
- THEN: You have found a Gann Square. This intersection represents a high-probability "turning point" where the market is likely to undergo a significant change in direction.
💡 Pro Tip
The "Squaring" Secret: The Gann Fan is only as good as its "scaling." For the angles to work correctly, the chart must be properly "squared," meaning a move of 1 point in price must equal 1 unit of time (like 1 day). If your chart scaling is off, the 45-degree angle won't actually represent the 1x1 balance. Always check your charting software’s "Lock Bar Spacing" or "Gann Square" settings to ensure the geometry is accurate before trading.

Momentum Addiction
It usually starts quietly.
Three wins in a row. Then four. Nothing crazy. You followed your rules. The trades worked. You did your job.
But something shifts.
You don’t change your strategy. You change your behavior.
You click faster.
You hesitate less.
You stop double-checking risk because it “looks obvious.”
It’s like driving the same road every day. After a while, you stop paying attention to the turns. You still arrive. Until one day you don’t.
Momentum does not mean you got better overnight. It means conditions lined up in your favor.
That’s it.
When traders confuse that with growth, they borrow confidence they haven’t earned yet.
Here’s how you stop it from turning into damage.
When you’re on a streak, do the opposite of what your body wants.
Slow your execution.
Cap your size.
Force a pause before every entry.
Write down why the trade fits your plan. If you can’t explain it in one sentence, skip it.
Treat winning periods like icy roads. That’s when control matters most.
Momentum fades. Process lasts.
The traders who survive know the difference.