Oracle Stock Collapses 14%
....................................................................................................................


TGIF!
It’s the final trading day of the week — and Wall Street is stepping into Friday with a weird mix of swagger and side-eye. Tech is limping, value is flexing, and the Dow is trying to extend its all-time high like it’s finishing the week with bragging rights.
Dow futures are up about 0.3%, S&P futures are basically standing still, and the Nasdaq is sliding again as traders keep rotating out of the AI darlings. It’s the same story: Broadcom disappointed, Oracle stirred fresh AI doubts, and chip giants like Nvidia continue to lose their shine.
But not every name is suffering — Lululemon came out swinging, jumping 11% after announcing a leadership shake-up investors actually liked. Calvin McDonald is stepping down, and Wall Street interpreted it as the reset the brand needs.
With all three major indexes still on pace for weekly gains, investors are using today to reposition, recalculate, and decide whether the Fed’s 2026 outlook means “more room to run” or “time to cool expectations.”
It’s a mixed-market Friday — and everyone’s trying to lock in a win before the weekend hits.

📈 Stocks Hit Record Highs as Investors Rotate Out of Tech
The Dow and S&P 500 closed at fresh record highs while the Nasdaq lagged, signaling a rotation into cyclical and value sectors as traders trim tech after a Fed rate cut and weakening AI stock leadership.
💣 Oracle’s $300B OpenAI Bet Backfires on Wall Street
Oracle’s stock plunged over 10% and dragged tech peers lower after disappointing results and ballooning AI investment costs sparked fears its massive OpenAI-linked spending may be overextended.
🌐 Broadcom’s Run Faces Reality Check From Skeptics
After a strong AI-chip driven rally, some analysts warn Broadcom may be overvalued amid slowing tech breadth and cyclicals drawing more investor interest — suggesting upside may be capped.
🎬 Retail Investors Loading Big on Netflix at 40% Discount
Individual traders are piling into Netflix shares after a sharp selloff, betting the media giant can rebound and shake off weak engagement trends — even as critics call the valuation stretched.
🆙 Crypto Markets Bounce After Fed Rate Cut
Bitcoin and broader crypto markets are showing a rebound following the Fed’s interest rate cut, and analysts say the typical post-cut bounce could morph into a deeper year-end rally if risk sentiment improves.
🏆 Rivian’s AI Chip Reveal Sends Shares Lower — Nvidia Feels the Aftershock
Rivian unveiled its first in-house autonomy AI chip and new self-driving tech at its Autonomy & AI Day — yet investors weren’t impressed, pushing Rivian stock down ~6–8% and knocking tech peers like Nvidia as the market questions execution and cash burn.
🟡 Gold Near Seven-Week High as Traders Eye More Fed Cuts
Gold prices stayed elevated near $4,286/oz, buoyed by rising expectations for further Federal Reserve rate cuts and a weaker dollar — keeping bullion in demand as markets navigate a dovish U.S. policy outlook.

Your Doubt Doesn’t Define Your Ability
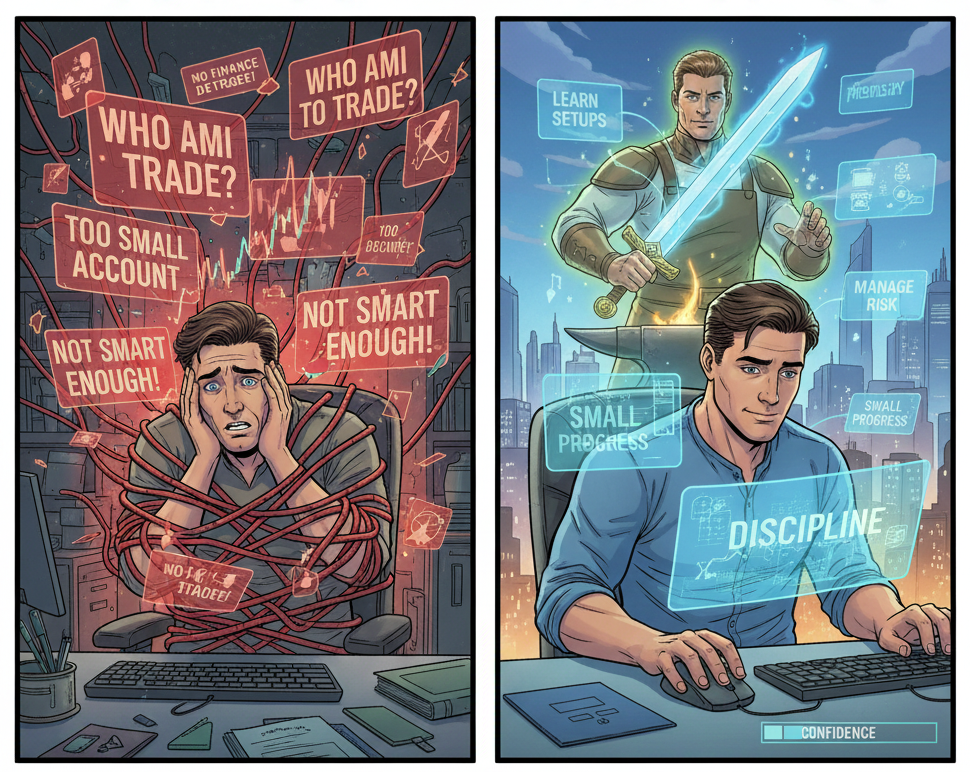
Many new traders feel out of place. They think trading belongs to people with finance degrees or big accounts. That doubt creates a barrier before they even learn the basics. They judge themselves instead of studying the craft.
Skill in trading comes from practice. You learn setups. You learn risk. You learn how to stay calm during a trade. None of this requires a title or a background. Doubt fades when you follow a process and see progress in small steps.
Your ability grows from repetition, not confidence. Confidence comes after the work.
If you want guidance that helps you build structure and trust your decisions through simple daily study, these newsletters give you clear steps to follow.

Diamond Top
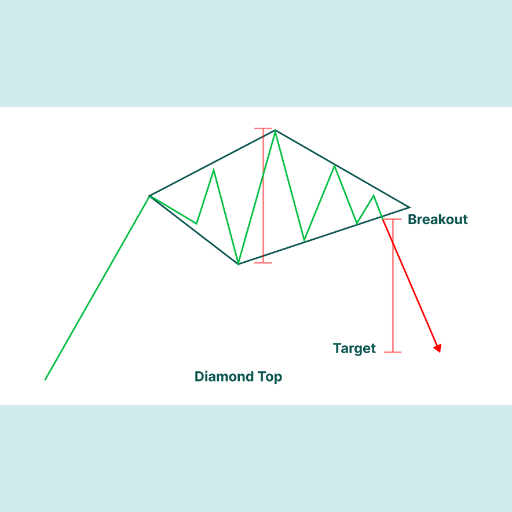
The Diamond Top is a complex and relatively rare bearish reversal chart pattern that typically forms at the peak of a long, strong uptrend. It is considered a powerful signal that the buying interest is exhausted and a major downtrend is about to begin.
The pattern is formed by price action that initially widens (making higher highs and lower lows, resembling an expanding triangle) and then symmetrically narrows (making lower highs and higher lows, resembling a symmetrical triangle). When the four extreme points are connected by trend lines, the resulting shape looks like a diamond or a lozenge.
What to Look For:
The Diamond Top requires careful observation due to its complexity and is highly indicative of volatility and indecision at the market peak.
- Prior Uptrend: The pattern must be preceded by a distinct and strong uptrend for it to be a valid reversal signal.
- Expansion Phase (Left Side): The first half of the pattern shows increasing volatility. The price makes successively higher highs and lower lows, causing the outer boundaries to expand outward. This reflects confusion and aggressive trading at the peak.
- Contraction Phase (Right Side): The second half of the pattern shows decreasing volatility. The price begins to make successively lower highs and higher lows, causing the boundaries to contract and converge. This suggests the market is calming down and losing momentum.
- The Neckline/Support: The most critical boundary is the lower right trend line (the bottom edge of the converging side). This line acts as the final support level for the pattern.
- Volume Trend: Volume typically increases during the initial widening phase and then decreases during the final narrowing phase (the right side of the diamond). Volume should then spike significantly upon the bearish breakdown.
- Bearish Confirmation (Breakdown): The pattern is confirmed when the price breaks decisively below the lower right trend line (the final support). This breakdown is the key entry signal for a short position and must be accompanied by a surge in selling volume.
- Target Price: The traditional price target is calculated by measuring the widest part of the pattern (the vertical distance from the highest high to the lowest low) and projecting that distance downward from the breakdown point.

The Price of Thinking for Yourself
Objectivity in trading feels simple on paper.
See the chart.
Read the signal.
Take the trade.
But in real life, it’s isolating.
Most traders follow noise. They trade what the group is excited about.
They copy sentiment, narratives, and opinions because it feels safer than standing alone.
You can feel the pressure every time you take a position that goes against what everyone around you is saying.
That’s the real test.
Not the charts.
Not the setup.
The ability to stay with your read even when other traders think you’re wrong.
Good trading doesn’t happen in crowded rooms.
It happens in quiet decisions.
It happens when you choose the chart over chatter.
Going against the crowd as it were.

It happens when you stop needing agreement.
Objectivity asks you to ignore hype.
Ignore fear.
Ignore the need for validation.
Most people can spot a setup.
Few can stand alone long enough to act on it.
Trading turns into an edge the moment you stop asking for permission.