
OpenAI’s Golden Touch
....................................................................................................................


Traders, the mood on Wall Street this Wednesday is… quiet.
Futures are barely moving as everyone waits for the Fed minutes to drop later today - the only real clue left in a week starved of economic data thanks to the government shutdown.
With the September jobs report missing in action and Washington still locked in a standoff, the market’s flying blind.
Tuesday snapped the S&P 500 and Nasdaq’s seven-day winning streak, thanks to weaker cloud margins at Oracle stirring fresh AI jitters. Meanwhile, gold just doubled in two years and is now dancing around the $4,000 mark as investors pile into safety plays.
So yeah, it’s a “hurry up and wait” kind of day — but beneath the stillness, traders are bracing for movement.
Let’s get in 👇

💻 OpenAI’s Touch Moves Markets
Figma, HubSpot, Salesforce — all up big after being name-dropped. AMD stole the show with a $63B value boost. This market’s worshipping AI like it’s gold.
📉 Gold Pulls Back from $4K
The metal’s rally hit resistance as dollar strength returned. Global jitters from Washington to Paris kept markets on edge.
💰 Traders Go Blind, Buy Gold
No data, no problem. The shutdown’s got Wall Street guessing, and momentum junkies are chasing gold above $3,900 and BTC past $125K.
📈 Bitcoin Enters Price Discovery
BTC’s strongest weekly finish ever signals fresh upside. Futures flows, profits, and onchain metrics all flash one word: bullish.
🚗 Tesla Teases Big Reveal, Stock Pops
Shares popped 5% after Elon dropped two cryptic clips hinting at an October 7 event. Traders are betting it’s either the long-delayed Roadster or a cheaper Model Y.
🔥 AMD Ignites on OpenAI Deal
Shares exploded +23% after AMD sealed a multibillion-dollar GPU deal with OpenAI. The AI giant will take a 10% stake in AMD — roughly 160 million shares as part of the partnership to deliver 6 gigawatts of chips starting 2026.
📉 B&M Warns of Profit Slump
Shares dipped after the UK discount retailer projected a 28% drop in first-half earnings and a weaker year ahead. New CEO Tjeerd Jegen blamed “weak operational execution” and vowed to fix it with a turnaround plan dubbed “Back to B&M Basics.”

Your Last Loss Doesn’t Define Your Next Win
Every trader remembers that one trade - the one that wiped out days, weeks, maybe months of progress. It’s the kind of loss that echoes in your mind every time you hover over the “Buy” button.
But losses aren’t verdicts. They’re feedback. They don’t define your future - they point out what needs to change.
So don’t let your past mistakes become a sentence. Study them. Learn from them. Move forward with new clarity.
Charts don’t carry grudges. Neither should you.
👉 Want consistent insights to help you rebuild smarter?
Check out this curated collection of trading newsletters.

Exponential Moving Average (EMA)
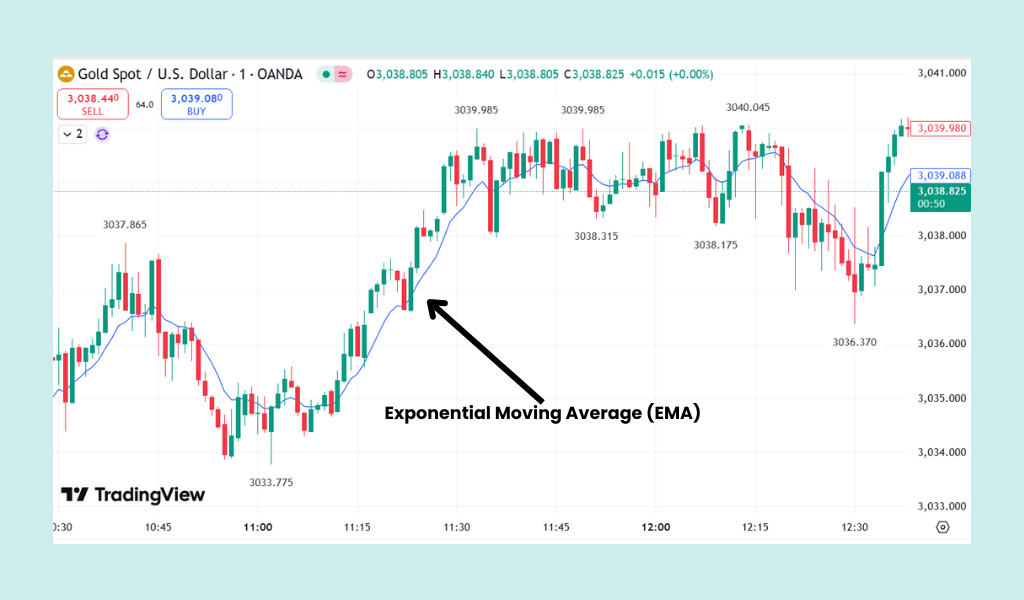
An EMA is a technical analysis indicator that smooths out price data over a specified period to create a single line. Like all moving averages, its primary purpose is to help traders visualize the underlying trend direction by filtering out short-term price noise.
The key difference from the SMA is in the calculation: instead of weighting all data points equally, the EMA applies an exponential smoothing factor (Multiplier) that prioritizes the latest closing prices. This makes the EMA "hug" the price action more closely.
What to look for:
When using the Exponential Moving Average in trading, look for the following characteristics and signals on a price chart:
1. Trend Direction 📈📉
The direction of the EMA line is the most basic signal for the current trend:
- Uptrend (Bullish): The EMA is sloping upward, and the price is generally trading above the EMA line.
- Downtrend (Bearish): The EMA is sloping downward, and the price is generally trading below the EMA line.
- Ranging/Consolidation: The EMA is relatively flat, and the price is fluctuating both above and below the line.
2. Dynamic Support and Resistance
The EMA often acts as a dynamic (or moving) support or resistance level for the price:
- In an uptrend, the rising EMA acts as a support level. Traders often look to buy when the price pulls back and touches or slightly dips below a rising EMA before bouncing back up.
- In a downtrend, the falling EMA acts as a resistance level. Traders look to sell (short) when the price rallies up to test or slightly exceed a falling EMA before continuing down.
3. EMA Crossovers (The Most Common Trading Signal)
Crossovers, which involve two or more EMAs of different lengths, are used to signal trend changes and generate entry/exit points:
- Bullish Crossover (Golden Cross): A shorter-term EMA (e.g., 50-period) crosses above a longer-term EMA (e.g., 200-period). This is a strong signal of a new or accelerating uptrend.
- Bearish Crossover (Death Cross): A shorter-term EMA crosses below a longer-term EMA. This is a strong signal of a new or accelerating downtrend.
4. Responsiveness and Time Periods
The EMA's period (N) determines its responsiveness:
- Shorter EMAs (e.g., 9, 12, 20-period): Highly sensitive to price; used by day traders and scalpers to identify fast, short-term momentum and entry/exit points. These provide quicker signals but are prone to more "false" signals.
- Longer EMAs (e.g., 50, 100, 200-period): Less sensitive; used by swing and position traders to identify medium- to long-term trends and major support/resistance zones.
You should check out the Why the EMA Is a Must-Have Tool in Every Trader's Toolbox video to see how EMA lines act as dynamic support and resistance levels.

Consistency Beats the Chaos
This game can break you before it builds you.
You’ve studied. You’ve prayed. You’ve spent late nights backtesting while the world sleeps.
And still… the chart stares back, and everything you thought you knew feels blurry.

But here’s the hard truth: consistency beats talent, luck, and even strategy.The traders who win aren’t always the smartest — they’re the ones who show up, every day, even when it’s brutal.
Stop looking for the perfect moment or flawless setup. Focus on progress, not perfection.
Here’s what actually moves the needle:
- Show up even when doubt screams louder than confidence.
- Trade smaller but smarter — repetition builds clarity.
- Accept mistakes as part of the process, not proof you’re failing.
- Embrace slow growth — small steps compound faster than you think.
- Detach from outcomes, anchor to the process.
This market rewards the patient and punishes the desperate. Stay in the room. Keep showing up. Effort never betrays you.


