Oil Surges on Trump's Threat
....................................................................................................................


Good morning.
After a week that felt like one long "risk-off" nightmare, we’re seeing a tiny bit of green this Monday morning. Futures for the S&P 500 and Nasdaq are up about 0.5%, mostly because President Trump decided to push his "energy grid strike" deadline back to Tuesday. It’s not exactly a peace treaty, but in a market that’s been bruised for five straight weeks, we'll take any breather we can get.
Oil is finally losing its grip on the steering wheel. Brent crude, which was threatening to run away to $130, has cooled off to around $107 after reports surfaced that a 45-day ceasefire plan is officially on the table. WTI is following suit, sliding back toward $109. It’s a massive relief for our wallets, but don't get too comfortable—this "cooldown" is currently held together by a last-ditch diplomatic push from Pakistan and international mediators.
The "Jobs Surprise" is the wildcard today. While the floors were closed for Good Friday, the March jobs report dropped a bombshell: 178,000 new jobs and a dip in unemployment to 4.3%. It’s a sign of a resilient economy, but with big inflation data looming this Friday, investors are left wondering if the Fed will use this strength as an excuse to keep rates "higher for longer."
We’re bouncing for now, but with the Tuesday strike deadline ticking and most global markets still closed for Easter Monday, the volume is thin and the headlines are everything.

🛢️ Oil Whipsaws as Trump Issues "Power Plant Day" Ultimatum
Energy markets turned volatile Monday after President Trump warned Iran would be “living in Hell” if the Strait of Hormuz isn't reopened by Tuesday at 8 p.m. ET. U.S. crude briefly topped $114 before sliding to $109.70, as traders weigh the threat of targeted strikes on Iranian power plants against ongoing back-channel deal rumors.
📊 Futures Whipsaw After S&P 500 Snaps Losing Streak
Major averages moved sideways Monday following a relief rally that saw the S&P 500 gain 3.4% last week, breaking a five-week slump. Tickers like ASTS and MRVL remain in focus as investors balance "Power Plant Day" geopolitical risks against a flurry of fresh economic data.
🇨🇳 Chinese Chipmakers Hit Record Revenue Amid U.S. Restrictions
Domestic semiconductor firms in China reported record-breaking annual revenue, fueled by an AI infrastructure boom and state-led efforts to bypass U.S. export curbs. Beijing’s push for homegrown tech has allowed local players to capitalize on a critical global shortage of high-end memory chips.
🌏 Asian Shares Edge Higher on De-escalation Hopes
Despite several regional holidays, Asian markets managed slight gains Monday as investors clung to hopes for a Middle East ceasefire. The Nikkei added 0.55%, buoyed by a strong Wall Street performance last week, even as a firm dollar and high oil prices complicate the regional outlook.
🥇 Gold Recovers Toward $4,700 Despite Rate Hike BetsBullion prices bounced off the $4,600 level to trade near $4,700, showing resilience despite a firm U.S. dollar. While inflationary concerns are bolstering bets for higher global interest rates, dip-buyers are stepping in to support the metal amid the ongoing geopolitical standoff.
₿ Crypto Markets Bounce on Trump’s Mixed Signals
Bitcoin and altcoins trended higher after President Trump told reporters a deal with Iran was "getting close," despite his aggressive social media rhetoric. The conflicting signals provided enough cover for a relief bounce as liquidation pressure eased across major exchanges.
🔥 Bloomberg Analyst Calls Bitcoin ETFs "Hot Sauce" for Portfolios
Exchange-traded funds continue to see robust inflows as analysts compare Bitcoin to "hot sauce" in a diversified portfolio—high-impact in small doses. Despite the geopolitical volatility, institutional adoption remains a core pillar of market support as investors use BTC as a tactical hedge.

Too Much Information, Not Enough Decisions
You open your chart… and everything is there.
Indicators, signals, news, opinions. One says buy. Another says wait. Another says sell. The more you look, the less clear it becomes.
So you do nothing.
That’s where the problem starts.
Too much information creates hesitation. You keep searching for confirmation. You add more tools. You wait for everything to align perfectly. But that moment rarely comes.
More data does not mean better decisions.
Strong traders simplify. They use a few clear tools. They define what matters and ignore the rest. Their decisions come from structure, not overload.
When you reduce noise, clarity improves. You act faster. You trust your process. You stop second-guessing every signal.
Simplicity improves execution.
Some traders like seeing how others simplify markets and focus on what matters.
If that’s you, you can explore a few market reads here:

SuperTrend Indicator
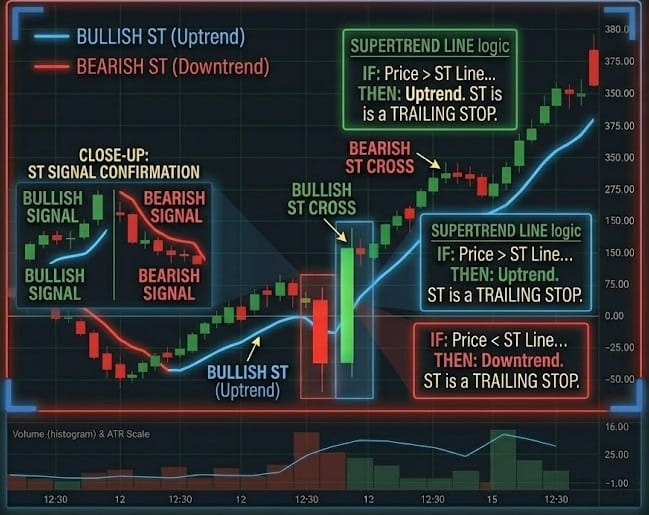
The SuperTrend is a trend-following indicator that combines price action with volatility. It is plotted on the price chart and uses the Average True Range (ATR) to calculate its distance from the current price. It acts as a dynamic support and resistance line that "flips" its position and color based on whether the bulls or bears are winning the volatility battle.
🛠️ The Strategy Logic
Use these logical triggers to ride long-term trends and identify the exact moment a trend "breaks":
- IF: The SuperTrend line flips from Red to Green and moves below the price...
- THEN: A bullish trend has been triggered. This indicates that the price has closed above the volatility-adjusted resistance level, signaling a high-probability "Buy" entry.
- THEN: A bullish trend has been triggered. This indicates that the price has closed above the volatility-adjusted resistance level, signaling a high-probability "Buy" entry.
- IF: The SuperTrend line flips from Green to Red and moves above the price...
- THEN: A bearish trend is now in effect. This suggests that the downward momentum has breached the volatility floor, signaling an exit for longs or an entry for shorts.
- THEN: A bearish trend is now in effect. This suggests that the downward momentum has breached the volatility floor, signaling an exit for longs or an entry for shorts.
- IF: The price is in a strong uptrend and touches the Green SuperTrend line without closing below it...
- THEN: The line is acting as Dynamic Support. This is a classic "Buy the Dip" zone. As long as the candle close remains above the line, the uptrend is considered intact despite short-term pullbacks.
- THEN: The line is acting as Dynamic Support. This is a classic "Buy the Dip" zone. As long as the candle close remains above the line, the uptrend is considered intact despite short-term pullbacks.
- IF: The SuperTrend line is moving "Flat" (horizontal) for several candles...
- THEN: The market is in a Consolidation or sideways phase. Volatility is low, and the price is "ranging." Be careful here; SuperTrend is prone to "whipsaws" (false flips) in sideways markets.
- THEN: The market is in a Consolidation or sideways phase. Volatility is low, and the price is "ranging." Be careful here; SuperTrend is prone to "whipsaws" (false flips) in sideways markets.
- IF: The distance between the Price and the SuperTrend line becomes exceptionally wide...
- THEN: The market is "Overextended." Price has moved too far away from its volatility-adjusted mean. While the trend is still valid, the risk of a sharp "mean reversion" back toward the line is high.
💡 Pro Tip
The "Multiplier" Secret: Most traders use the default setting (Period 10, Multiplier 3). However, if you are trading a highly volatile asset, a Multiplier of 3 might flip too often.
To catch "Super Trends," try a Multiplier of 4.0. This makes the indicator "slower" and less sensitive to minor noise, allowing you to stay in a massive move much longer without being shaken out by a single bad day.
Always use the SuperTrend as a Trailing Stop-Loss—simply move your stop to the level of the line every time a new candle closes.

You Remember the Wins… Not the Mistakes
Ask a trader about their best trade.
They’ll tell you everything.
The entry.
The timing.
How clean it was.
How price moved perfectly.
Now ask about their worst execution.
Silence. Vague answers. “Just one of those trades.”
That’s the bias.
YOUR BRAIN STORES REWARD.IT DISCARDS DISCOMFORT.
Big wins get replayed.
Mistakes get blurred.

So over time, a false narrative builds:
“I’m trading well.”
“My system is solid.”
“I just need more size.”
But the reality?
Sloppy entries.
Early exits.
Missed rules.
Inconsistent risk.
All quietly ignored because the memory of a few big wins dominates everything else.
THIS DISTORTS YOUR SELF-ASSESSMENT.
You think you’re executing at a high level.
But your actual behavior tells a different story.
That gap is dangerous.
Because you don’t fix what you don’t see.
Professionals don’t rely on memory.
THEY RELY ON DATA.
They journal trades.
Track execution.
Review mistakes — especially the uncomfortable ones.
Not to punish themselves.
But to see clearly.
Because the goal isn’t to remember how good your best trade felt.
It’s to understand how consistent your process actually is.
Let’s be real:
One big win can hide ten small mistakes.
And if those mistakes aren’t addressed, they compound.
So here’s the shift:
Stop replaying your highlights.
Start reviewing your execution honestly.
The trades you don’t want to look at?
Those are the ones that will improve you the most.
Because the market doesn’t reward what you remember.
It rewards what you repeat.