
Nvidia Invests $30B in OpenAI
....................................................................................................................


Good morning, traders!
Wall Street is waking up with a bit of a bid this Friday, but there’s a lot of noise to filter through. Both the S&P 500 and the tech-heavy Nasdaq are grinding about 0.3% higher, while the Dow is a bit quieter.
After the market snapped a three-day winning streak yesterday, the bulls are trying to find their footing before a massive wave of data hits.
The real story today is the dual threat of inflation and geopolitical heat. Everyone is sitting on their hands waiting for the PCE index—the Fed’s favorite way to measure inflation. If that number comes in higher than expected, it’s going to be a tough climb for anyone hoping for interest rate cuts soon.
At the same time, oil is catching a serious bid as tensions between the US and Iran boil over. With a potential 10-day window for military decisions, energy prices are a major wildcard right now.
The Nasdaq is finally looking to snap a five-week losing streak, but with big earnings from Nvidia and Dell next week, things could get choppy fast.
Keep your stops tight and watch the inflation print to set the tone for the close.

⚖️ Markets Brace for Tariff Shock
The U.S. Supreme Court could deliver a ruling that reshapes U.S. trade policy in an instant. Traders are preparing for a potential knee-jerk reaction if tariffs are upheld or struck down.
📉 Wall Street Stocks Slip as Oil Climbs
Wall Street closed modestly lower while tensions with Iran kept crude prices elevated. Investors are balancing mixed economic data with rising geopolitical risk.
🥇 Gold Breaks Above $5,000
Bullion extended its rally as Middle East tensions intensified. Comments from Donald Trump about giving Iran just days to strike a deal added fuel to the safe-haven surge.
🤖 Nvidia’s $30B AI Bet on OpenAI
Nvidia is reportedly close to investing $30 billion in OpenAI. The deal could value the ChatGPT maker near $830 billion and mark one of the largest private raises ever.
🌏 Asia Mixed as AI Fears Linger
Japan’s Nikkei 225 fell 1.1% as financial stocks slid on AI-related credit concerns. U.S. futures edged higher but sentiment remains fragile.
💊 Sumitomo Sinks Despite Approval
Sumitomo Pharma plunged nearly 16% even after securing government backing for its Parkinson’s therapy. Traders appeared to lock in profits following recent gains.
🛢️ Oil Hits Six-Month High
Brent climbed toward $72 as Trump warned Iran it has just 10–15 days to reach a nuclear deal. Markets are pricing in the risk of supply disruptions if tensions escalate.

Deleting a Strategy After One Bad Candle
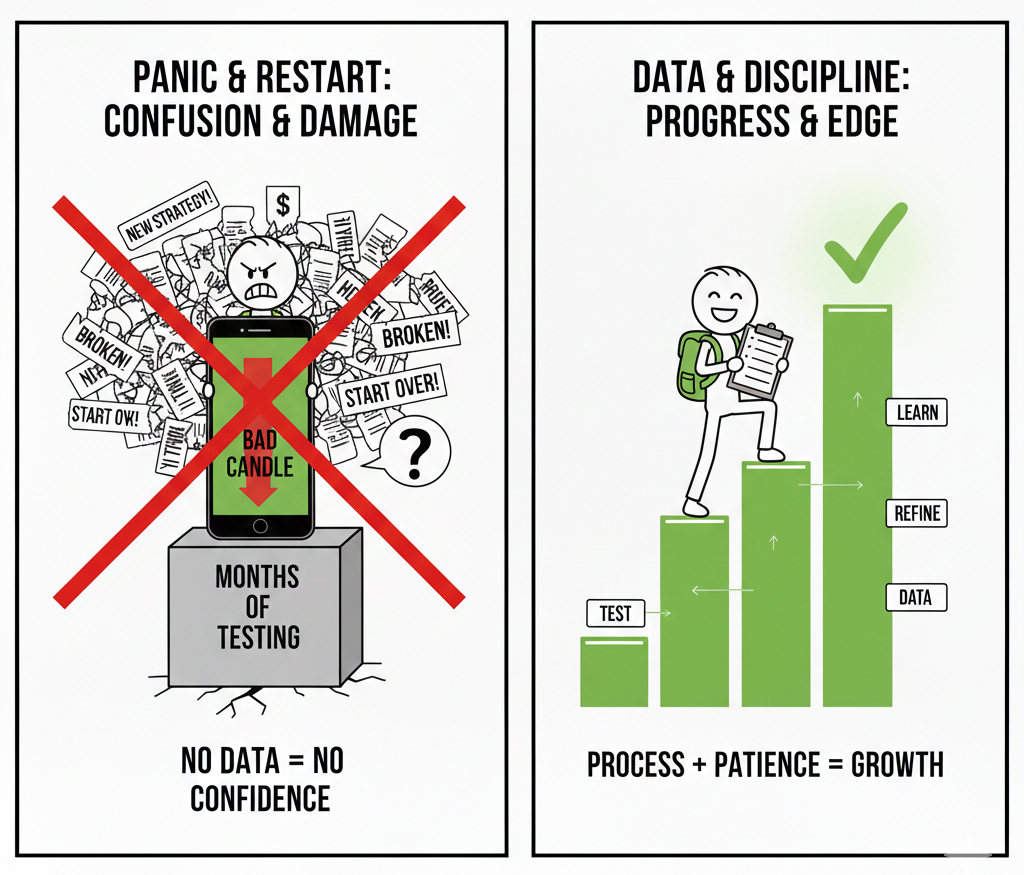
One losing trade does not mean your strategy is broken. One bad candle does not erase months of testing. Yet many traders panic after a small loss and jump to something new.
That’s where the real damage begins. You never gather enough data to know what works. You keep restarting. Confidence drops because nothing gets the chance to prove itself. Progress turns into confusion.
Strong traders judge strategies over many trades, not one result. They review execution, risk, and consistency. They improve small mistakes instead of abandoning the whole plan.
When you stay with a tested strategy long enough, patterns become clear. You learn what normal losses look like. You build confidence because your decisions come from evidence, not emotion.
If you want trading guidance that teaches you how to evaluate strategies properly and stay consistent instead of jumping after every loss, these newsletters help. They focus on discipline, structure, and steady improvement.

Doji
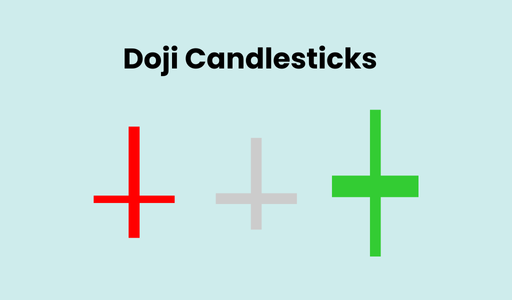
A Doji is a single-candle pattern where the opening and closing prices are virtually identical. Visually, it looks like a cross or a plus sign.
It represents a state of total equilibrium and "tug-of-war" where neither the bulls nor the bears could gain the upper hand by the end of the session.
In trading, a Doji is the ultimate symbol of market indecision.
🛠️ The Strategy Logic
Use these logical triggers to identify when a trend is about to stall or reverse:
- IF: A Doji forms after a long, aggressive uptrend or downtrend...
- THEN: The current trend is exhausted. The "unanimous" conviction that was driving the price has disappeared, and the market is now questioning its direction.
- IF: The Doji is followed by a candle that closes above the Doji’s high (for a bottom) or below its low (for a top)...
- THEN: The reversal is confirmed. A Doji by itself is just a "pause," but the direction of the next candle tells you who won the tug-of-war.
- IF: The Doji has very long upper and lower wicks (a "Long-Legged Doji")...
- THEN: Volatility is extreme but directionless. This shows that both sides tried to take control with massive force but both failed, often preceding a violent breakout in either direction.
- IF: The Doji forms exactly at a Middle Keltner Channel or a major Moving Average...
- THEN: The market is "re-testing" its fair value. This is a common spot for a trend to either "rest" before continuing or to fail completely. Look for the breakout of the Doji's range to decide your entry.
- IF: The Doji is a "Dragonfly" (long lower wick) or a "Gravestone" (long upper wick)...
- THEN: You have a directional hint. A Dragonfly at a bottom suggests a strong rejection of lower prices, while a Gravestone at a top suggests a strong rejection of higher prices.
💡 Pro Tip
The "Quiet Before the Storm": Never trade a Doji in isolation. Think of a Doji like a "yellow light" at a traffic intersection—it means slow down and look.
The most profitable way to trade a Doji is to look for Volume Divergence.
If a Doji forms at a new high but the Volume Oscillator is falling, it’s a high-conviction signal that the "smart money" has stopped buying and a crash is imminent.

The Fat Finger Syndrome
Open your platform and count the tabs.
Indices. Crypto. FX. Two timeframes each. News feed running. Discord pinging.
Another chart half-watched on the side.
It feels like opportunity.
It is cognitive overload.
When attention gets thin, mistakes get basic.
- Wrong size typed.
- Wrong level clicked.
- Wrong ticker selected.
Not because you lack skill. Because you split it.
Trading punishes scattered focus.
The brain does not perform precision work well while juggling noise. Every additional chart taxes decision quality.
Every extra setup competes for mental bandwidth.
Here is the uncomfortable truth:
More markets do not mean more edge. They mean more temptation.
Try this instead.
- Pick two instruments.
- Pick one or two setups only.
- Trade the same time window every day.
Run the same routine until it becomes boring.
Depth compounds. You start recognizing nuance.
You feel rhythm shifts faster. Execution becomes cleaner because you are not context-switching every five minutes.
Variety feels productive. Focus pays better.
In trading, specialization is not limiting.
It is leverage.


