
Nvidia Bulls Charge In!
....................................................................................................................


Happy Friday, Traders!
Gold just shattered records, soaring past $2,853 - could $3,000 be next?
Bitcoin dipped below $100K, rattled by trade war fears, but ETF inflows suggest not all hope is lost.
On the flip side, Toyota is racing toward a record $31B profit, and tech stocks are heating up, with Palantir soaring 24%.
Like always, we’ve got the crucial updates - so let’s dive into the biggest stories shaking up the markets this week! 🚀

🔝 Gold Hits New All-Time High!
Gold just smashed a new record at $2,853.97 per ounce! Investors are rushing in as the US-China trade war reignites, fueling fears of economic instability. Could $3,000 be the next stop?
🐻 BTC Slips Under $97K as Bears Take Control
Bitcoin has been flashing a bearish signal, with sell signals flashing across the charts and resistance at $100K proving too strong, traders are watching key support levels at $91K.
🚨 Tesla Stock Overvalued, Brace for a Correction, Warns Investor
Tesla stock surged 109% last year, but one investor is urging caution, predicting the bubble may burst sooner than expected. With weakening vehicle registrations and growing global competition, including from BYD, can Tesla continue to live up to sky-high expectations?
🚗 Toyota's Profit Surge: Up 9%, Nearing $31 Billion Target
Despite a weaker-than-expected third-quarter result, Toyota has raised its full-year profit forecast by 9%, now aiming for a record $31 billion. Even with the looming risk of U.S. tariffs, the automaker is confident, citing strong hybrid demand and a dominant position in global sales.
💡 ‘Buy In Around $100,’ Says Investor on Nvidia Stock
Nvidia stock has been hit with a 19% drop amid concerns over AI tech and potential tariffs, but savvy investor James Foord sees this as a prime buying opportunity.
🍃 Calm Returns to Wall Street, Tech Stocks Lead
After a volatile start to the week, Wall Street found its footing on Tuesday, with tech stocks leading the charge. Palantir Technologies was a standout, surging 24% on strong earnings and an optimistic revenue forecast, signaling confidence in the AI revolution.
🔥Oil Slips as Rising US Stocks and Trade Worries Pressure Market
Oil prices took a hit on Wednesday, with rising U.S. crude inventories and fears of a fresh trade war between China and the U.S. dragging the market down.

Market Update: Holding Steady & Watching for Clearer Signals
I’m still holding onto my previous positions as we wait for them to play out.
For today, there are no new recommendations.
The market isn’t showing a clear direction yet.
Instead of forcing trades, we’re staying patient and waiting for better setups.
Once the market gives us a clearer trend, we’ll have more opportunities to capitalize on.
Stay sharp, and I’ll update again soon!

Think Trading Is Only for Math Wizards? Here’s How to Win Without Crunching Numbers!

If the thought of complicated charts, endless calculations, and mind-numbing equations has kept you from trading, you’re not alone.
Many believe that only math geniuses and finance pros can succeed, but that’s just not true.
Winning in trading isn’t about crunching numbers.
It’s about understanding patterns, managing risk, and making smart decisions.
That’s why learning from the right sources makes all the difference.
These handpicked newsletters strip away the unnecessary complexity and focus on what actually works.
They break down strategies in a simple, step-by-step way, helping you spot opportunities without drowning in technical jargon.
You’ll see how to make trades with confidence, using real-world insights instead of intimidating formulas.
Think of it like cooking.You don’t need to know the chemical breakdown of ingredients to follow a great recipe and get amazing results.
Get the clear, no-nonsense trading strategies you need inside these newsletters!

MACD Histogram
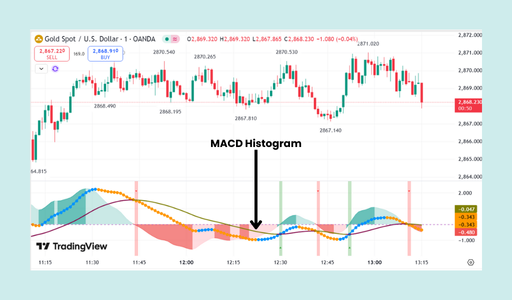
The MACD Histogram is a visual representation of the difference between the Moving Average Convergence Divergence (MACD) line and its signal line.
It provides a dynamic view of the relationship between these two lines, offering insights into the strength and direction of price momentum.
Key Characteristics:
- Visual Representation: The histogram is displayed as a series of bars, with positive bars indicating that the MACD line is above the signal line, and negative bars indicating the opposite.
- Momentum Indicator: The height of the bars reflects the distance between the MACD line and the signal line, providing a visual measure of the strength of the current trend.
- Early Warning Signals: The histogram can often anticipate changes in trend direction before they are fully reflected in the MACD line itself.

“Study the charts.”
Yeah, we’ve all heard that before. But what does it actually mean?

Studying like you study for college?
Staring at candlesticks all day?
Running a few backtests and calling it a day?
If it were that simple, everyone would be printing money.
Real studying isn’t about memorizing setups - it’s about understanding why the market moves the way it does.
It’s about catching the unwritten rules that no one can teach you. And that takes more than just scrolling through old price action.
Here’s what actually works:
🔹 Study with intent – Don’t just look at charts. Analyze how price reacts to your strategy’s key levels.
🔹 Study in real-time – The market behaves differently when money’s on the line. Observe how conditions shift live.
🔹 Study to refine – Found something new? Don’t just add it blindly. Test it, tweak it, and see if it actually fits your system.
The goal isn’t to copy what worked before - it’s to train your mind to see patterns before they unfold.
That’s the real edge.


