Nike in Trouble
....................................................................................................................


Good morning.
Yesterday we tried asking ChatGPT if it could predict the market.
It replied with, “I am not a financial advisor.” Coward. 😂
So instead, we stuck to what we can do - read the tea leaves of futures, headlines, and just a bit of trader intuition.
And just yesterday?
Futures dipped like a scared cat near a bathtub - all thanks to Wall Street suddenly rethinking the so-called Tariff Truce.
Apparently, "peace" in trade wars is more fragile than your stop-loss on CPI days.
But that’s not all:
The crucial update section below will walk you through the featured headlines.

⬇️ Futures Dip as Wall Street Reconsiders the Tariff Truce
S&P, Dow, and Nasdaq futures pull back as warnings grow louder. Is the rally built on shaky ground?
🇮🇳 Foxconn Shifts $1.5B Into India
As tensions and tariffs make China less predictable, the iPhone supply chain continues its quiet migration to safer ground, India.
👟 Nike Cuts Staff, But Retail Sentiment Remains Deep in the Red
Layoffs, outsourcing, and a turnaround plan haven’t been enough to shake off the bearish cloud hanging over the swoosh.
🪙 Bitcoin Briefly Tops $106K as Bulls Steady the Climb
The world’s largest crypto flirted with fresh highs before dipping slightly to $104K. But with stable funding rates and cooler sentiment, this rally has legs without the froth.
🇨🇳 Stimulus Sparks Rally as China Tries to Jumpstart Growth
CATL soars, stocks surge, and central banks ease up. But without stronger demand at home, these policy moves may only offer a temporary lift.
🛢️ Oil Ticks Up as US-Iran Nuclear Talks Hit a Wall
Crude prices inched higher as nuclear talks faltered and hopes of fresh Iranian supply dimmed. Will geopolitical tensions send oil even higher?
🟡 Gold Slips as Peace Prospects Erode Safe-Haven Appeal
Trump’s call with Putin sparks truce optimism, easing demand for gold. The safe-haven rush may be pausing, but is it over?

First Solar Inc. (NASDAQ: FSLR) – TP2 Hit, Trade Closed
We entered a sell at $178.50, watching for a sharp reversal after First Solar hit major resistance and started to crumble.
The rejection came fast - no hesitation, no whipsaw.
While our original TP2 was set at $158.04, I decided to close all positions early at $162.93.Securing a gain of 8.57% before leverage.
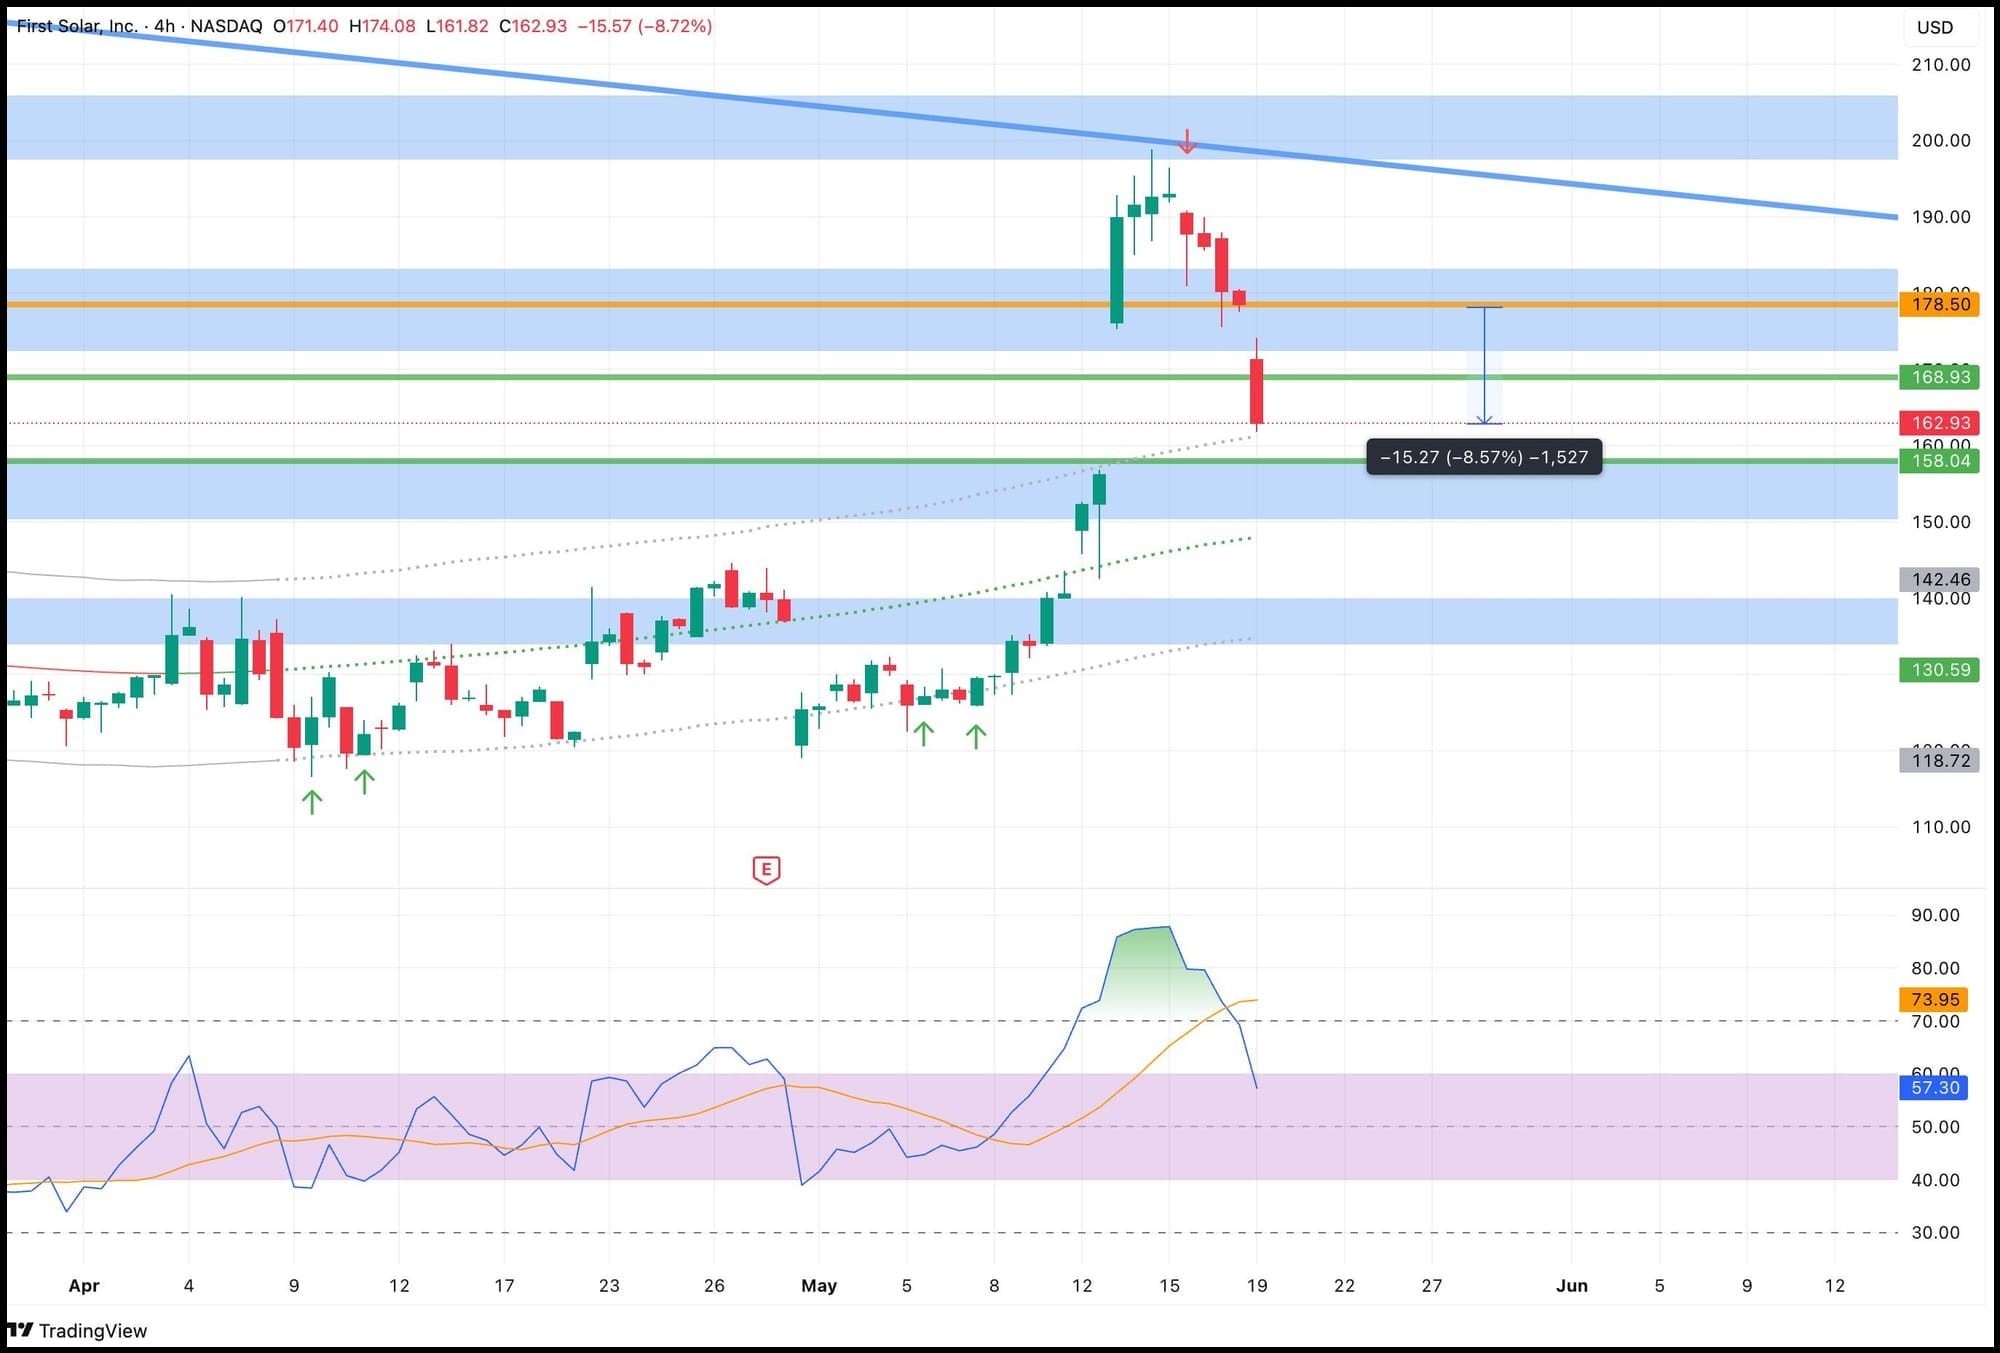
The move was clean, the breakdown decisive.
Sometimes it’s not about squeezing every dollar - it’s about locking in the right profits at the right time.
Trade closed. Risk managed. Win booked. 📉✅
Recommendation: AAON Inc. (NASDAQ: AAON)
AAON has been riding high - but now, the signs of fatigue are showing.
Price is pressing into a familiar ceiling, and momentum is starting to soften.
RSI is bending, not crashing - but enough to hint that the bulls may be running on fumes.
We’re stepping in for a sell at $104.53.
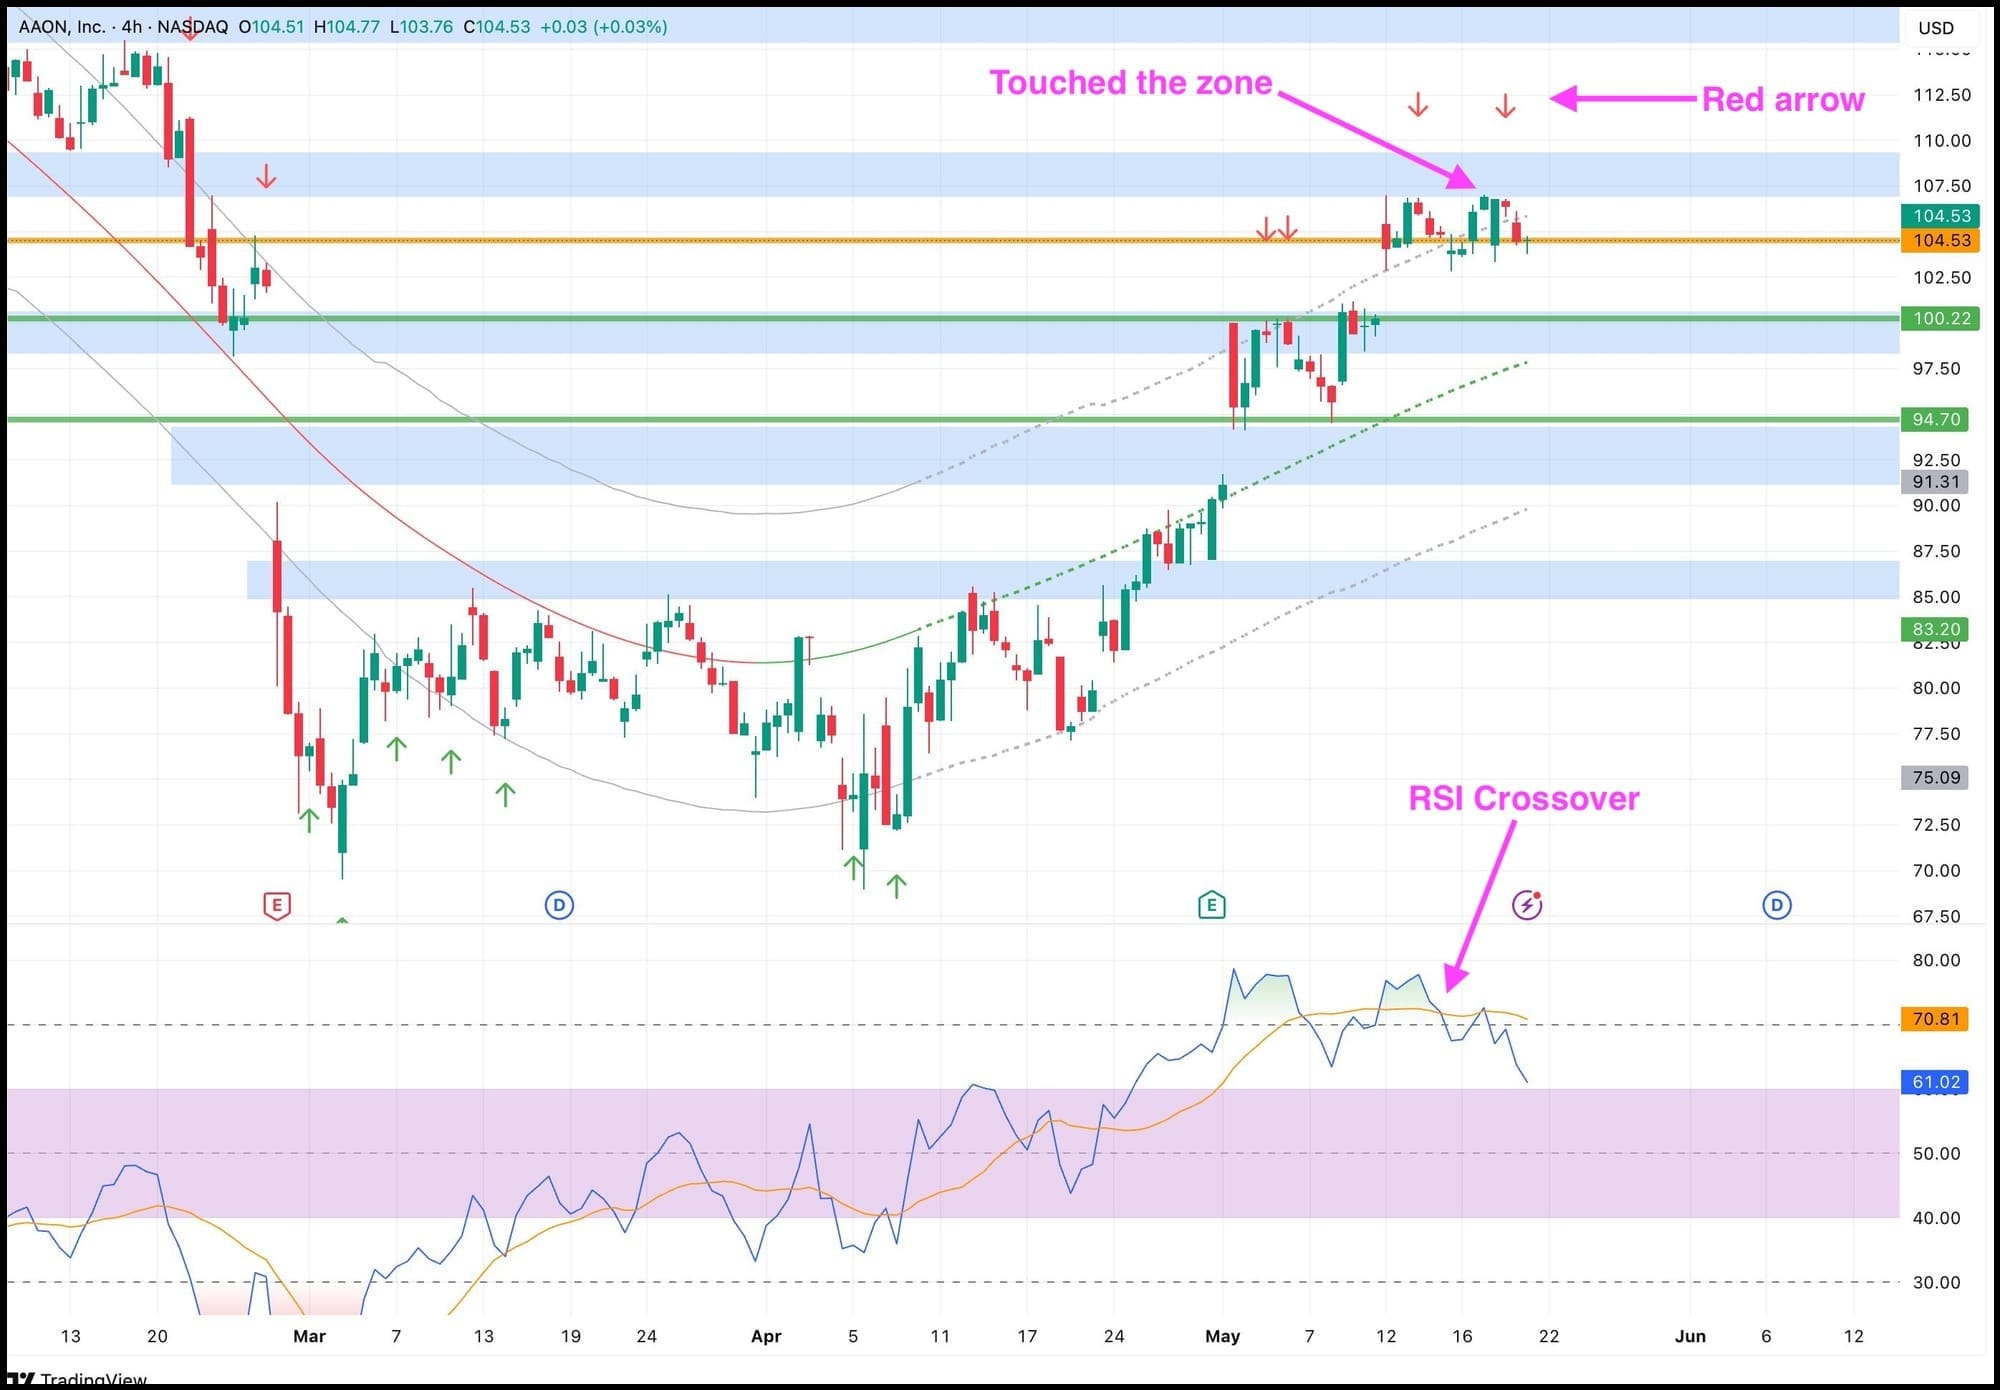
Not because we’re betting on a collapse, but because the chart is offering us a clean setup for a controlled pullback.
🎯 Targets:
Sell: $104.53
TP1: $100.22
TP2: $94.70
This isn’t about chasing drama.
It’s about reading the shift - quietly, early, and with conviction. 📉🔥

This Isn’t a Math Test. It’s a Strategy Game.
You don’t need to be a math wizard to succeed at trading - in fact, obsessing over numbers is what holds many beginners back.
The real edge in trading comes from understanding patterns, risk, and psychology - not solving equations.
These newsletters break it down in plain English, showing you how to build simple, repeatable strategies that don’t require a calculator or a spreadsheet obsession.
If you’ve been avoiding trading because you “suck at math,” these newsletters will show you a smarter, simpler way to win:
👉 Get the insights you need here

Rate of Change (ROC)
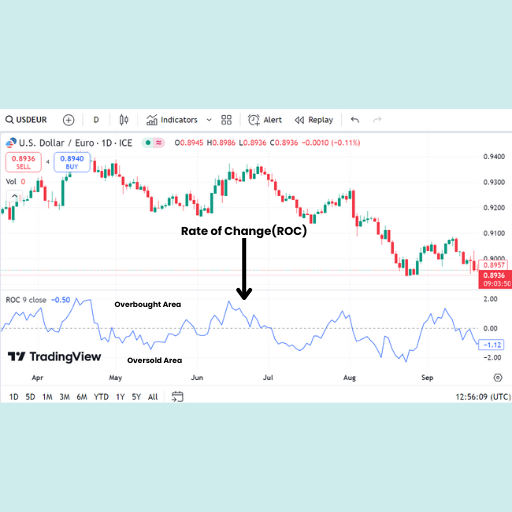
The Rate of Change (ROC) is a momentum-based technical indicator that measures the percentage change in price over a specified period. It oscillates around a zero line and helps identify overbought/oversold conditions and potential trend reversals.
What to Look For:
- Zero Line:
- Above Zero: Indicates that the price is currently higher than it was N periods ago (where N is the period setting), suggesting upward momentum.
- Below Zero: Indicates that the price is currently lower than it was N periods ago, suggesting downward momentum.
- Crossovers: A crossover above zero signals increasing bullish momentum; a crossover below zero signals increasing bearish momentum.
- Trend Confirmation:
- Rising ROC in an uptrend confirms strong buying momentum.
- Falling ROC in a downtrend confirms strong selling momentum.
- Overbought/Oversold Conditions:
- Extremely high positive ROC readings can suggest an overbought condition, potentially indicating a price correction.
- Extremely low negative ROC readings can suggest an oversold condition, potentially indicating a price bounce.
- The specific levels for "extreme" vary by asset and historical context.
- Divergence:
- Bullish Divergence: Price making lower lows while ROC makes higher lows can signal weakening bearish momentum and a potential bullish reversal.
- Bearish Divergence: Price making higher highs while ROC makes lower highs can signal weakening bullish momentum and a potential bearish reversal.
- Magnitude: The magnitude of the ROC value indicates the strength of the momentum. A larger positive value means price is rising faster; a larger negative value means price is falling faster.

"You don't abandon your faith every time life gets hard. So why do that with your trading strategy?"
Let’s get real.
Catholics. Muslims. Buddhists.
Each with their own way of approaching God.
Each believing, without a doubt, that their path is the right one.

They don’t switch beliefs just because someone shouted louder.
They don’t abandon their faith after one bad week. But let’s bring this back to trading — because this is where Jack gets it, and Charles doesn’t.
🧠 Jack has a belief system.
He’s done the work.
He’s tested, refined, struggled, and stood his ground. His strategy?
It’s not just a bunch of rules - it’s his gospel.
He doesn’t panic when the market dips.
He doesn’t jump ship at every new “guru thread.”
Why?
Because he BELIEVES in his edge.
😩 Now, enter Charles.
He heard about a strategy on Monday.
He tried it on Tuesday.
Lost money on Wednesday.
Started doubting it by Thursday.
By Friday, he’s crying in a Telegram group saying, “Maybe this isn’t for me 😩💔”Bro... what happened?
He never built a belief system.
He doesn't own his strategy.
So the moment it tests him, he runs.
Or worse, FOMOs into something else.
That’s not trading. That’s spiritual confusion in chart form.
Here’s the truth no one wants to say:
You won’t stick with a strategy unless you believe in it the way people believe in God.
Unshakably.
Even when the market is trying to baptize you with fire.
💡 So what do you do?
- Stop chasing strategies like TikTok trends.
- Take one and go DEEP. Study it. Backtest it. Own it.
- Understand the psychology behind it. Make it yours.
- Build conviction — not just knowledge.
- Because when you truly believe in your edge, the market noise fades.
⛔️ Without belief, everything will shake you.
✅ With belief, even red days won't break you.
Faith isn’t blind — it’s built. So is consistency.
👊🏼 Build your system.
Believe in it.
Then hold the line like your soul depends on it.