Nvidia Approved!✅
....................................................................................................................


Good morning,
US stock futures are basically inching forward this morning — not weak, not excited, just…waiting. It’s one of those market days where everyone knows the real action doesn’t start until the Fed speaks, so traders are staying close to neutral.
Dow, S&P 500, and Nasdaq futures are all slightly positive, but the mood is deliberate. With nearly a 90% probability priced in for another quarter-point rate cut, investors want confirmation, not surprises. And inside the FOMC, opinions are still split: some want to support the cooling labor market, others are worried that easing too quickly might stir inflation back to life.
Tuesday didn’t offer much momentum either — the Dow slipped on JPMorgan weakness while Tesla and Alphabet kept the Nasdaq in the green.
Today’s spotlight shifts to Oracle’s earnings, a key read for anyone tracking the AI-cloud trade. Broadcom, Costco, and Lululemon follow on Thursday, rounding out a packed week.
The market isn’t sleepy — it’s calculating. Everyone’s positioning for what comes next.

🇨🇳 Nvidia Gets Green-Light to Sell H200 Chips to China
The U.S. government just approved export of Nvidia’s H200 AI chips to China — triggering a 2% after-hours bump — but China may limit uptake, and Beijing’s pivot to domestic AI hardware threatens to mute the upside.
📋 Oracle Eyes Earnings as Wall Street Questions AI BubbleAs Oracle heads into its next earnings report, analysts are watching for cracks — in a sector where optimism about AI may be giving way to caution.
⚪ Silver Climbs Strong, Past $60 — Investors Eye Metals for Safety
Bullion is rising as demand for safe-haven metals picks up, with silver taking center stage as inflation and interest-rate uncertainty linger.
📉 JPMorgan Stock Drops After 2026 Spending Warning
JPMorgan shares sank nearly 5% after the bank flagged US$105 billion in costs next year, fueling concerns about margin pressure in a rising-cost environment.
💰 Elon Musk Targets SpaceX $1.5T Listing
SpaceX is racing toward a record-breaking IPO, fueled by Starlink’s explosive revenue surge. This could be the biggest debut ever — and Musk knows it.
🪙 Bitcoin Reclaims $94 K — But Liquidity Doubts Linger
BTC just popped back above $94,000, sparking talk that the bull run may be reviving — yet weak liquidity and a murky post-Fed outlook leave many traders asking: is this just a bounce or the real deal?
✂️ Fed Poised for Third Cut — But 2026 Is the Real Wildcard
The Fed is likely to deliver another 25-basis-point cut, but the message won’t be cheerful: policymakers are deeply split, inflation is still too high, and 2026 could bring fewer cuts — or none at all.

The Right Broker Is the One You Understand
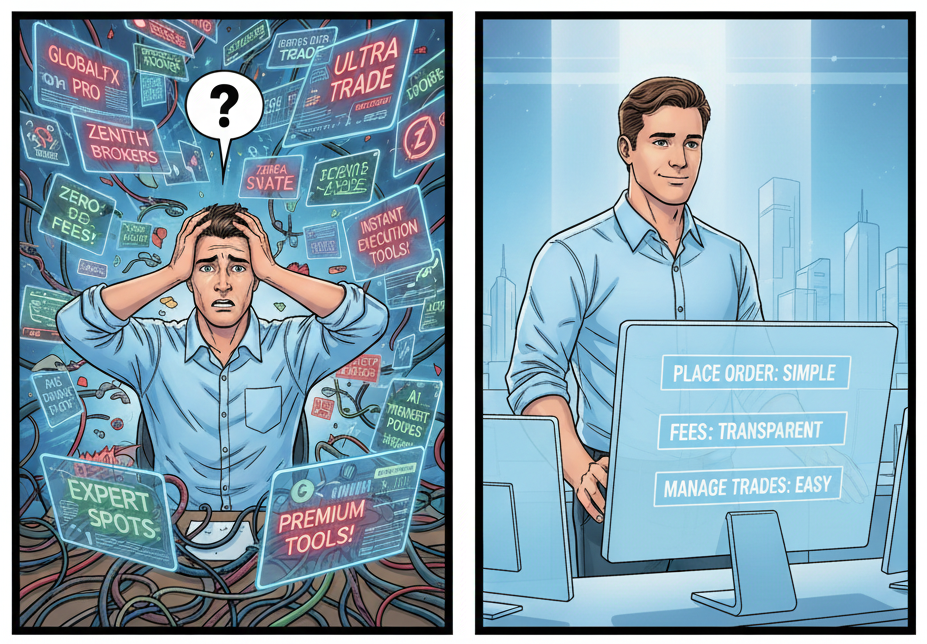
Many new traders freeze because broker choices feel endless. Each platform claims better spreads, tools, or features. That overload creates doubt. You delay trading because you fear choosing wrong.
The truth is simple. A good broker is one you understand. You know how to place orders. You know the fees. You can read the charts. You can manage your trades without confusion. Safety and clarity matter more than flashy features. Once you know how a platform works, confidence replaces hesitation.
You move forward when the tools make sense to you, not when the options disappear.
If you want guidance that helps you pick a broker with confidence and focus on trading instead of research loops, these newsletters break down the essentials in a simple way.

Williams %R
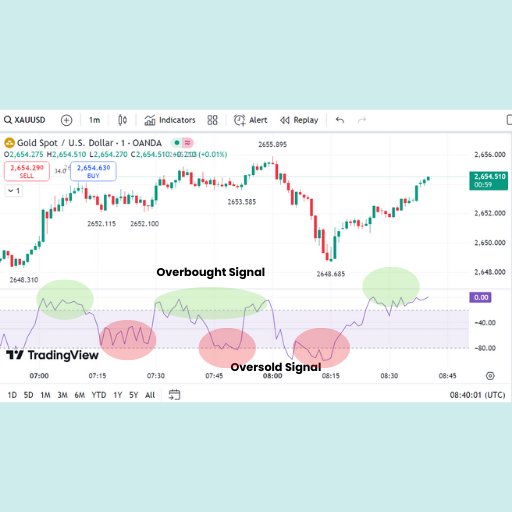
Williams %R (pronounced "Williams Percent R") is a momentum oscillator developed by Larry Williams. It measures overbought and oversold levels by indicating the closing price's position relative to the high-low range over a specific look-back period (typically 14 periods).
It is very similar to the Stochastic Oscillator, but with two key differences: it is inverted and is plotted on a scale from 0 to -100. This indicator is designed to anticipate price turning points by revealing when the buying or selling pressure has become exhausted.
What to Look For:
The Williams %R is an excellent tool for confirming trend reversals and identifying market extremes.
- Calculation: Unlike most oscillators that count up from 0 to 100, Williams %R measures the distance from the high. Its values are presented negatively, with 0 being the top of the recent price range and -100 being the bottom.
- Overbought/Oversold Levels:
- Overbought Zone (0 to -20): When Williams %R is in this range, it suggests the price is trading near the top of its recent range and may be due for a pullback or reversal.
- Oversold Zone (-80 to -100): When Williams %R is in this range, it suggests the price is trading near the bottom of its recent range and may be due for a bounce or reversal.
- Reversal Signals (Trading Action):
- Bullish Signal (Buy): Look for the indicator to move out of the oversold zone (crossing above -80). This suggests the selling pressure is easing and the bounce is beginning.
- Bearish Signal (Sell): Look for the indicator to move out of the overbought zone (crossing below -20). This suggests the buying pressure is easing and a pullback is beginning.
- Failure Swings (Confirmation): A stronger signal occurs when the indicator moves into an extreme zone, crosses back, and then fails to re-enter the extreme zone on a subsequent price move.
- Example: If the indicator drops below $-80$ and then moves back above, but the price keeps dropping and the indicator fails to drop back to $-80$, it is a bullish failure swing, suggesting the downtrend is weakening.
- Divergence: Divergence is a powerful signal.
- Bullish Divergence: Price makes a lower low, but the Williams %R makes a higher low (or fails to drop to the same extreme level). This warns of a potential bullish reversal.
- Bearish Divergence: Price makes a higher high, but the Williams %R makes a lower high. This warns of a potential bearish reversal.

Optimism Bias Bleeds Accounts
Every trader knows the feeling.
You take a bad entry. Price moves against you.
Instead of cutting, you start whispering the same quiet lie: it will come back.

That tiny spark of hope has destroyed more accounts than any wrong indicator, wrong timeframe, or wrong analysis.
Hope feels comforting in the moment, but it works like a slow leak in your trading survival.
This is optimism bias.
The belief that the market will reverse because you want it to.
Not because anything in the chart supports it.
So you hold.
You rationalize.
You widen stops.
You convince yourself it’s “temporary.”
You defend a losing position like it’s part of your identity.
Meanwhile, the market keeps doing what it always does.
Ignoring your feelings.
Great traders don’t wait for hope.
They cut fast.
They reassess.
They protect capital before they protect their ego.
A losing trade is never the problem.
The refusal to accept it is the real danger.
You don’t blow up because you were wrong.
You blow up because you stayed wrong for too long.