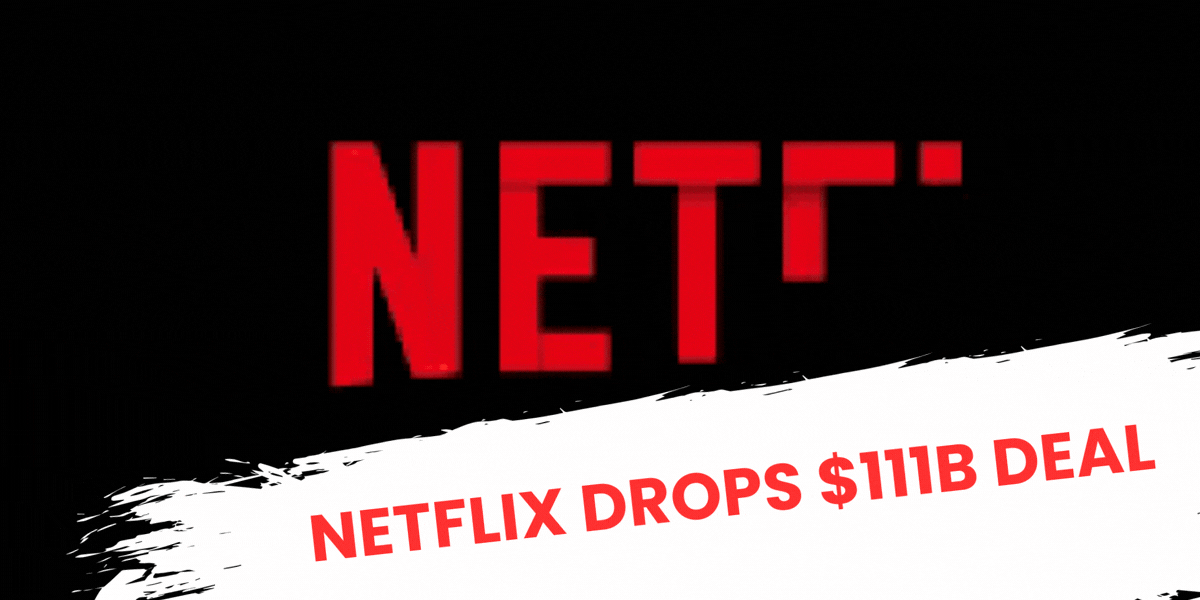
Netflix Drops $111B Deal
....................................................................................................................


Good morning, traders.
We’re seeing a bit of a "hangover" vibe this Friday after Nvidia’s massive run finally hit a wall. US futures are struggling to find their footing as a 5.5% slide in the AI king dampens the mood.
While Nvidia actually beat expectations (delivering $68.1 billion in revenue), the market is clearly asking: "How much higher can this AI spending actually go?"
The tech rotation took a wild turn yesterday with Jack Dorsey’s Block (XYZ). Shares are up over 23% after-hours following a bombshell: the company is cutting nearly half its workforce—from 10,000 down to 6,000—explicitly stating that AI tools now allow them to run much leaner. It’s a bold bet on automation that has the rest of the sector looking over their shoulders.
On the macro side, it’s all about the "wholesale" inflation check. We’re waiting for the January PPI report, with economists forecasting a 0.3% rise for both headline and core numbers. After a hot December, the Fed is looking for any excuse to stay on the sidelines, so this print will be a major market mover.
In other news, Netflix (NFLX) is surging after walking away from the Warner Bros. Discovery (WBD) bidding war, effectively handing the keys to Paramount Skydance.
It’s a move that signals a return to fiscal discipline for the streaming giant.
Our advice?
Keep an eye on those PPI numbers at 8:30 AM. They’ll tell us if the inflation beast is truly cooling or if we’re in for a bumpy ride through March.

📉 Futures Slip After Nvidia’s 5.5% Drop
Nvidia sank 5.5%, dragging Dow futures down 0.4% and S&P futures 0.2% as AI spending doubts grow. Traders now wait for the next inflation report.
🖥️ Dell Bets Big on AI Servers
Dell Technologies expects AI server revenue to double by 2027, sending shares up 10–12% in extended trading. Data center demand is still red-hot.
🎬 Netflix Walks Away From $111B Studio Deal
Netflix dropped its bid for Warner Bros. Discovery, clearing the path for Paramount Skydance’s $111B takeover. The streaming wars just got interesting again.
☁️ CoreWeave Slides as Capex Set to Double
CoreWeave warned spending could double this year, pushing shares down over 9%. Investors worry AI growth is getting too expensive.
🪙 XRP Drops 2.9% as Crypto Turns Cautious
XRP fell to about $1.41, while Bitcoin slipped 1.1% to $67,700. Only BNB held gains amid regulatory fears.
⚠️ Bitcoin Fails to Reclaim $68K
Bitcoin stalled near $67K after failing to break $68K resistance. Analysts say calling the end of the bear market is “premature.”
🌏 Asia Mixed After Nvidia Shock
Asia markets wobbled after the Nvidia slump, with Japan’s Nikkei 225 up 0.16% while China’s CSI 300 slipped. AI-linked stocks like Samsung and SoftBank fell.

Trading Is a Business, Not a Hobby
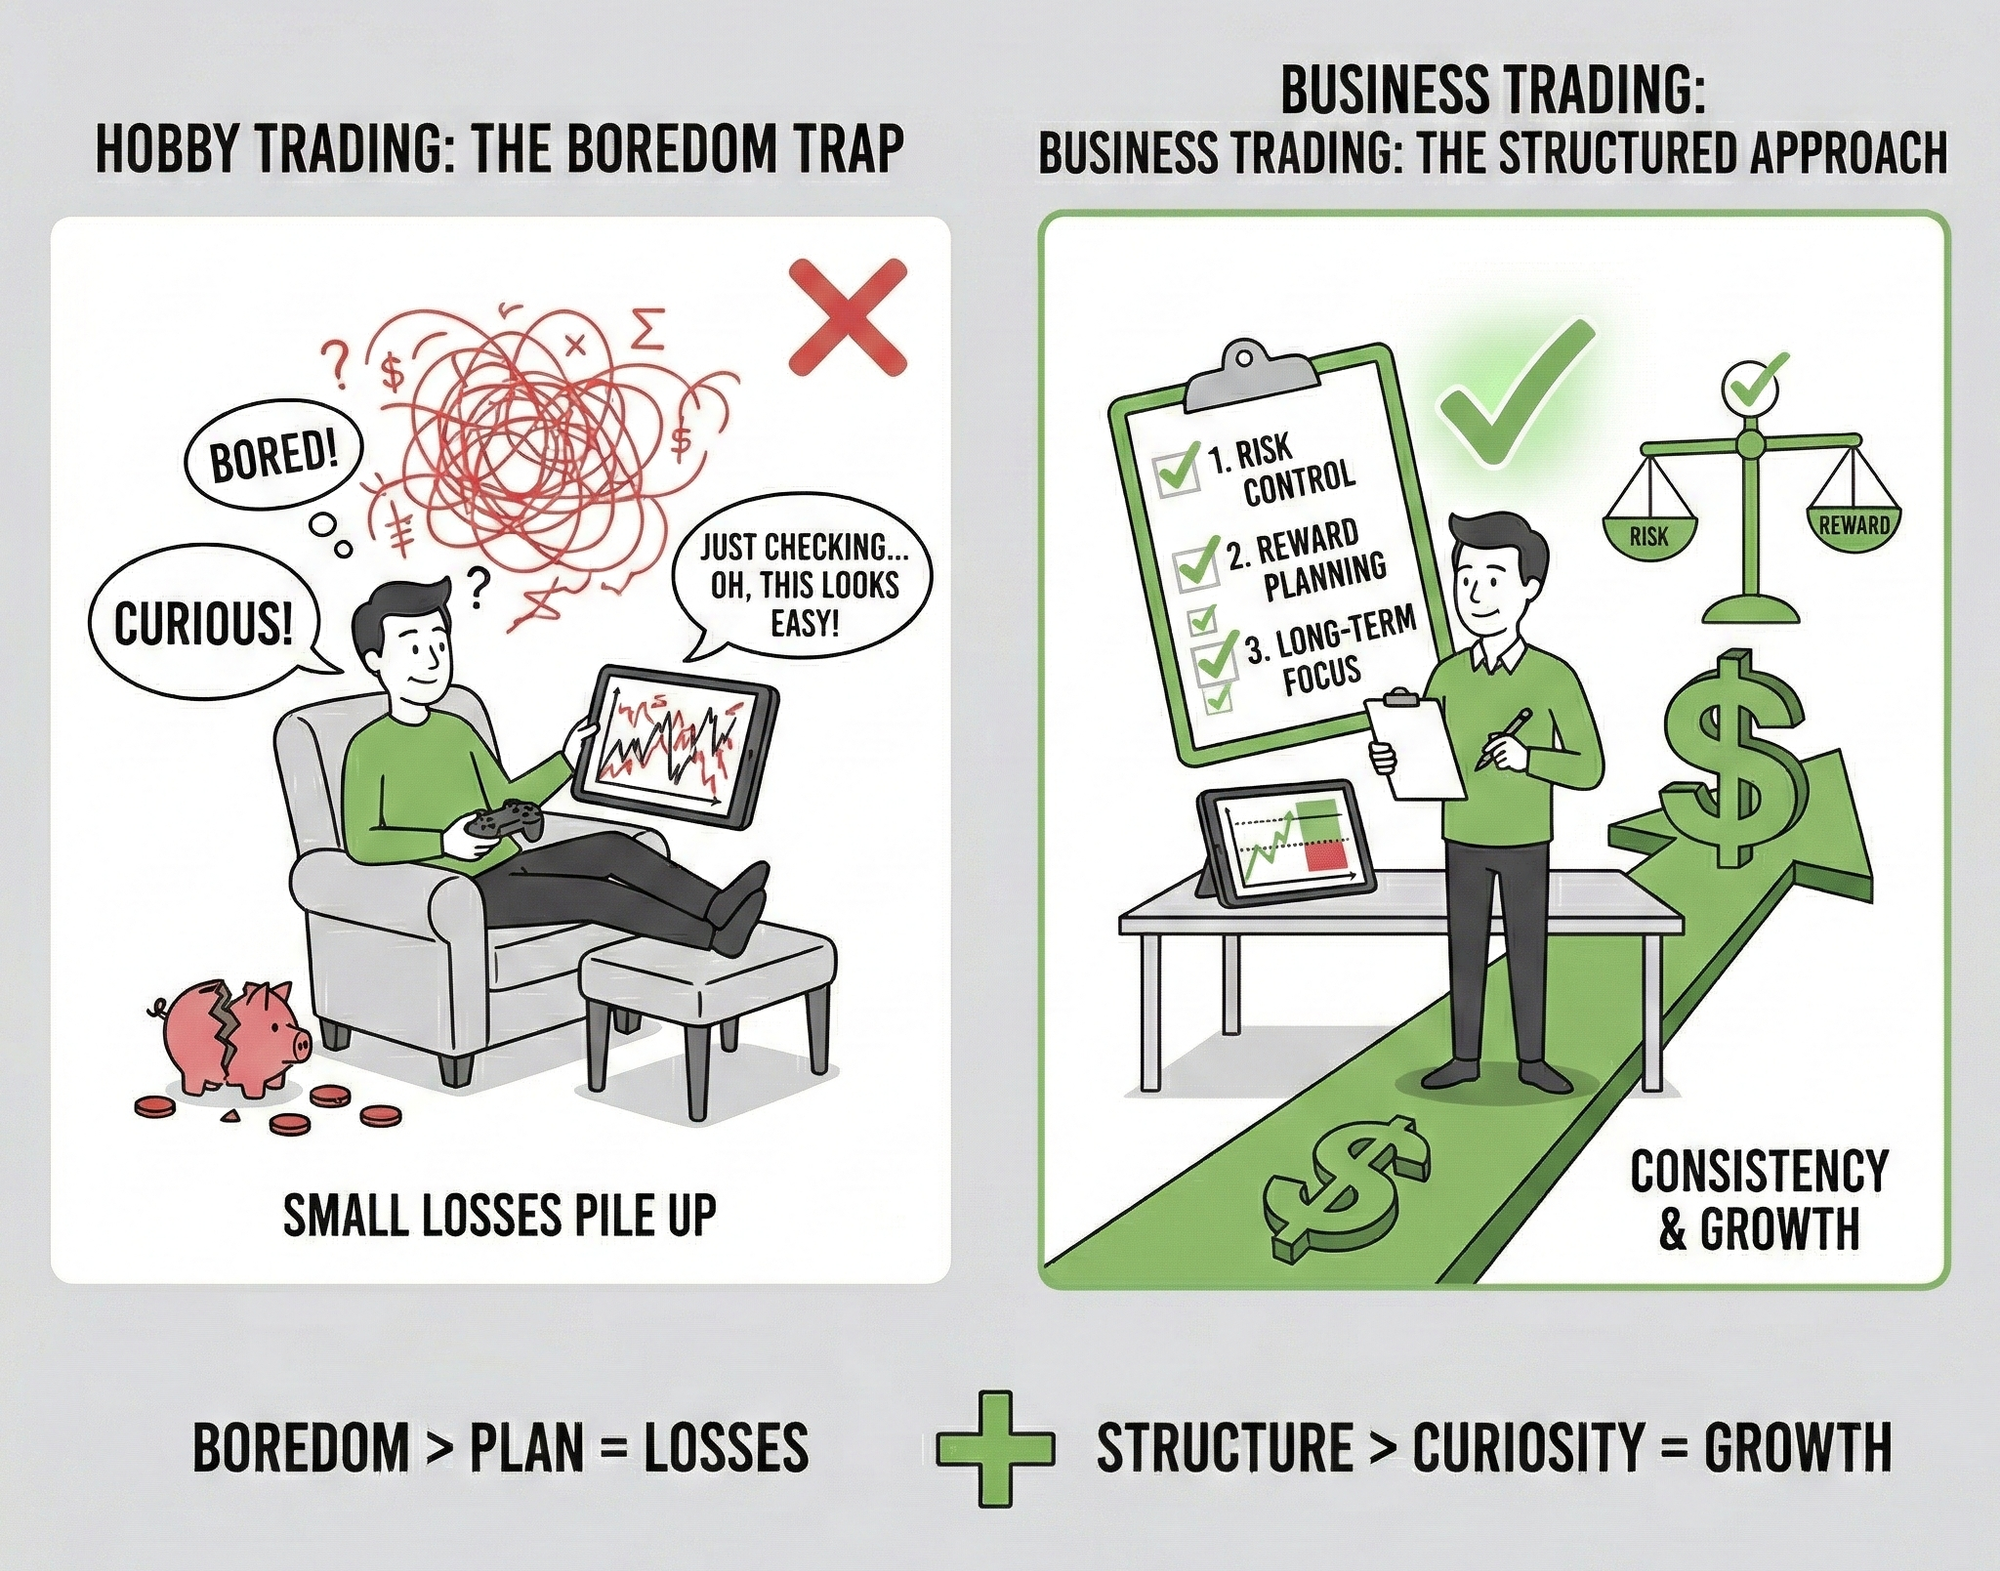
Trading out of boredom feels harmless. You open charts just to “see what’s happening.” Then you take a quick trade because you’re curious or restless.
That’s where problems begin. There is no plan. No clear risk. No real reason to be in the trade. Small losses pile up because the goal was entertainment, not execution.
Strong traders treat trading like a business. They have rules. They have hours. They have setups they wait for. If nothing fits, they close the charts and do something else.
When you trade with structure, your mindset changes. You stop chasing excitement. You start protecting capital. Your decisions become calmer because every trade has a purpose.
Discipline turns activity into results.
If you want trading guidance that constantly reinforces smart risk management instead of hype and greed, these newsletters help. They focus on structured thinking, clear risk-to-reward planning, and long-term consistency.

Qstick Indicator
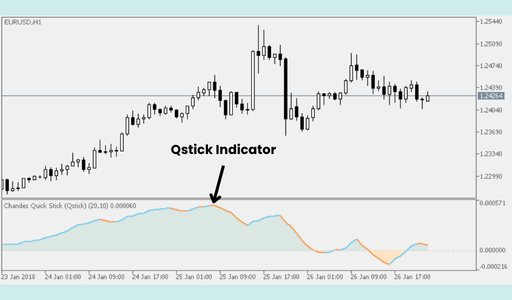
Developed by Tushar Chande, the Qstick indicator is a quantitative way to measure the "internal strength" of candlesticks. It calculates a moving average of the difference between the Close and the Open of each candle.
While a standard chart looks at price levels, Qstick looks at whether the market consistently closes higher than it opens, turning candlestick "sentiment" into a smooth, tradable line.
🛠️ The Strategy Logic
Use these logical triggers to identify hidden buying pressure and smooth out the "noise" of individual candles:
- IF: The Qstick line crosses above the zero line...
- THEN: Buying pressure is dominating. This means that, on average, the market is closing higher than it opens. It is a bullish signal that suggests a steady uptrend is forming.
- THEN: Buying pressure is dominating. This means that, on average, the market is closing higher than it opens. It is a bullish signal that suggests a steady uptrend is forming.
- IF: The Qstick line stays consistently above zero during a rally...
- THEN: The trend is healthy and "high-quality." It shows that bulls are maintaining control from the open to the close of each session, making it less likely for the trend to collapse suddenly.
- THEN: The trend is healthy and "high-quality." It shows that bulls are maintaining control from the open to the close of each session, making it less likely for the trend to collapse suddenly.
- IF: The price is making higher highs, but the Qstick line is making lower highs (Bearish Divergence)...
- THEN: The uptrend is "exhausted." Even though the price is climbing, the "bodies" of the candles are getting smaller or closing lower than they open, signaling that a reversal is imminent.
- THEN: The uptrend is "exhausted." Even though the price is climbing, the "bodies" of the candles are getting smaller or closing lower than they open, signaling that a reversal is imminent.
- IF: The Qstick line crosses below its own n-period moving average (Signal Line)...
- THEN: Momentum is shifting. Similar to a MACD crossover, this is an early warning that the current sentiment is weakening, allowing you to exit a trade before the zero line is actually crossed.
- THEN: Momentum is shifting. Similar to a MACD crossover, this is an early warning that the current sentiment is weakening, allowing you to exit a trade before the zero line is actually crossed.
- IF: The Qstick line is very far above or below the zero line and starts to "hook" back...
- THEN: The market is overextended. Extreme Qstick values indicate that the "buying/selling mania" has reached a peak and a mean-reversion move back toward the zero line is likely.
💡 Pro Tip
The "Body" Secret: Remember that Qstick ignores the "wicks" and only focuses on the bodies of the candles. This makes it the perfect partner for indicators like the Force Index (EFI).
While the Force Index tells you if volume is supporting the move, Qstick tells you if the intraday price action is actually bullish. If both are rising, you have a "Gold Standard" trend.
If Qstick is falling while EFI is rising, it means big volume is entering, but the bulls are struggling to hold their gains—a major red flag.

The Backtest Comfort Trap
You run the data.
Ten years. Clean stats. Beautiful equity curve.
Confidence rises.
“This works.”
Then you go live… and suddenly your hands feel different.
BACKTESTING TESTS STRATEGY.
LIVE TRADING TESTS YOU.
Historical charts don’t trigger fear.
They don’t tempt you to move stops.
They don’t whisper, “Close it now before it reverses.”
Backtests are silent.
Live markets are emotional.
In a backtest, you accept every loss because it’s just a data point.
In real time, that same loss feels personal.
So what happens?
You skip valid setups after two losers.
You cut winners early because the unrealized profit feels fragile.
You hesitate — and then chase.
The system didn’t break.
Your emotional execution did.
Backtesting builds belief. That’s powerful.
But belief without emotional conditioning is fragile.
Here’s the shift:
Forward test small.
Trade size that doesn’t trigger ego.
Focus on rule-following — not P&L.
The goal isn’t proving the strategy works.
It’s proving you can follow it when money is on the line.
Because the real edge isn’t in the data.
It’s in your ability to execute it under pressure.