Moore Threads Shares up 500%
....................................................................................................................


Happy Friday — and not just any Friday.
This is the most important Friday of the month because the market finally gets the one number that can make or break next week’s Fed decision: the PCE inflation report.
US stock futures are slightly higher this morning, but nobody’s trading with conviction yet. Why? Because with 87% of the market betting on a rate cut next Wednesday, today’s data could either lock that in… or flip the script entirely.
Investors are watching three things today:
- PCE inflation (the Fed’s favorite gauge) — the big one.
- Personal spending & income — a read on consumer strength.
- Michigan sentiment — a pulse check on household confidence.
Layer in yesterday’s mixed labor signals — job cuts rising while jobless claims hit a 2-year low — and you’ve got a market that wants a calm finish to the week… but knows volatility is just one number away.
So yes, TGIF — but today decides whether next week starts with champagne or chaos.

➖ Stocks Flat as Fed Hopes Clash With Weak Earnings Drag
U.S. indexes limped to a near-flat close as investors weighed fading rate-cut optimism against mixed company results — Amazon dragged the Nasdaq even as broader hopes for a Fed move kept sentiment from collapsing.
🚀 China’s “Nvidia Rival” Moore Threads Soars 500% on Debut
Moore Threads — dubbed “China’s Nvidia” — erupted up to 502% after its IPO on Shanghai’s STAR Market, fueling a wave of excitement that could reshape the global AI-chip supply chain.
📉 SoFi Tanked After Announcing $1.5B Share Sale
Shares of SoFi took a dive after the fintech firm revealed a large stock offering — a move seen by many as a sign of cash-flow strain, spooking investors already wary of rate and credit headwinds.
🪙 Bitcoin Poised to Climb Higher in December — Traders Gear Up
With selling pressure easing and sentiment improving, many crypto analysts are projecting a bullish December for Bitcoin — betting the worst is over for now.
💰 Smaller Asian AI Stocks Catch Investor Eye
As valuations tighten for mega-cap tech, investors are turning to smaller Asian AI firms — chasing the next big run in GPU and AI-software bets before year-end.
⬆️ Meta Jumps 5% on New AI Momentum and Product Wins
Meta’s stock popped after positive reports around its AI rollout and ad-tech strength — fueling renewed confidence that the social-media giant can pivot beyond maturity drag.
📈 Gold Edges Up as Dollar Dips and Rate Cut Odds Rise
Bullion is on the move again, climbing as the dollar slumps and rate-cut chances rise — with inflation jitters and global uncertainty steering investors back to safe-haven assets.

Your Money Needs Your Decisions, Not Someone Else’s
Many people believe profits belong to rich traders. They think large accounts get special treatment, secret access, and better results. That belief stops them before they begin. They assume starting small means staying small.
Real trading rewards discipline, not net worth. A clear setup works on $100 the same way it works on $100,000. A risk limit protects every account size. A strategy scales. Wealth does not create skill. Study and process create skill.
You grow by building rules and repeating them. Consistency compounds. Small accounts become larger accounts through patience and structure, not privilege.
If you want simple guidance that helps you build skill over balance, these newsletters show real strategies anyone can follow.

Rate of Change (ROC)
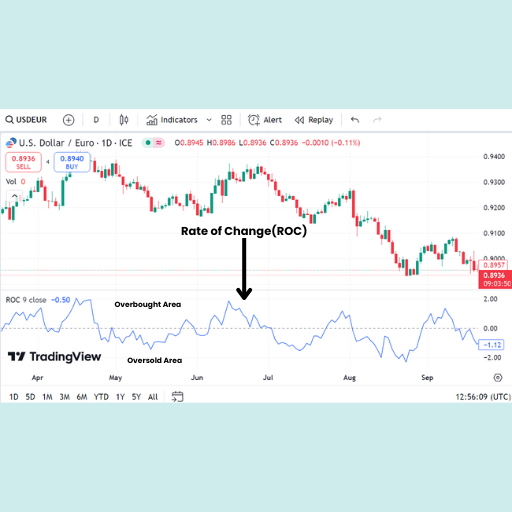
The Rate of Change (ROC) is a powerful momentum oscillator that measures the speed at which an asset's price is changing over a specified number of periods (N).
Its calculation is simple: it compares the current closing price to the closing price N periods ago, expressing the difference as a percentage. It is designed to identify the velocity of price movement,
What to Look For (Key Features and Signals)
The ROC is a versatile tool used for both trend confirmation and signaling reversals.
- Zero Line Crossovers (Momentum Shift):
- Above Zero: Indicates the price is currently higher than it was N periods ago, signaling upward momentum (bullish).
- Below Zero: Indicates the price is currently lower than it was N periods ago, signaling downward momentum (bearish).
- Crossover: A move above Zero confirms momentum has shifted to the upside, and a move below Zero confirms the shift to the downside.
- Overbought/Oversold Conditions (Extreme Readings):
- Extreme High Readings: Very high positive values (peaks) suggest the price has risen too quickly and may be overbought, often preceding a pullback or a top.
- Extreme Low Readings: Very low negative values (troughs) suggest the price has fallen too quickly and may be oversold, often preceding a bounce or a bottom.
- The specific levels that define "extreme" are relative and must be determined by looking at the historical readings for the specific asset.
- Divergence (Reversal Signal): This is the strongest signal, indicating momentum is not confirming price.
- Bearish Divergence: Price makes a higher high, but the ROC makes a lower high. This suggests the buying momentum is weakening, hinting at a potential bearish reversal.
- Bullish Divergence: Price makes a lower low, but the ROC makes a higher low. This suggests the selling momentum is weakening, hinting at a potential bullish reversal.
- Magnitude and Velocity: The magnitude of the ROC line (how far it is from the Zero Line) indicates the velocity or speed of the price change. The farther it moves from zero, the faster the price is currently moving in that direction.

The Comfort of Chaos

Some traders build their entire identity around movement.
If the market is fast, they feel sharp.
If candles explode, they feel tuned in. Volatility becomes a drug.
It gives them a sense of purpose they don’t have when things slow down.
But calm markets expose what chaos hides.
Calm markets show whether your rules exist or if you were simply reacting
Calm markets reveal if you have a plan or if noise was carrying you from trade to trade.
Calm markets test your patience in a way volatility never does.
Chaos gives you excuses.
Calm gives you a mirror.
If you only trade well when the market is wild, you don’t have an edge. You have adrenaline.
Real traders understand this.
They respect the slow days.
They don’t force setups to feel productive.
They don’t chase movement because they feel bored.
They sit through quiet charts and keep their standards the same.
Anyone can survive chaos.
The market does half the work for you.
It takes real discipline to stay sharp when nothing is happening.
Your growth lives in the silence.