Microsoft - Time to Buy?
....................................................................................................................


Good morning.
The market just caught the scent of a peace deal.
After weeks of staring at a "war fog" that wouldn't lift, we’re finally seeing some daylight. Rumors of a 15-point U.S. ceasefire plan sent a jolt of adrenaline through the morning session, with the Nasdaq jumping 1.2% out of the gate.
It’s like the entire trading floor just took a collective breath for the first time in March.
Oil is finally falling out of bed. The crude rally that was choking the economy just hit a wall, with Brent crashing nearly 6% to trade back under the $95 mark. For anyone who was worried about a $130 "heart attack" scenario, this retreat is the best news we’ve had all year.
WTI is following suit, sliding toward $87 as traders bet that the Strait of Hormuz might actually see some traffic again soon.
But don’t get too comfortable. While the Trump administration is pushing the "urgency" button, Tehran is still playing it cool and denying direct talks.
Plus, we have fresh import and export data hitting today that will show us the actual scar tissue left behind by the recent price spikes.
It’s a "green screen" morning, but keep your eyes open in this market, "cautious optimism" can turn into "total chaos" with a single tweet.

🚀 Futures Jump as Iran Peace Plan Signals Progress
U.S. stock futures climbed Tuesday night after Washington proposed a 15-point plan to end the conflict with Iran, easing fears of a prolonged blockade in the Strait of Hormuz. TSLA, GME, and LUNR are among the top tickers trending after-hours as risk appetite returns to the market.
📉 Oil Prices Plunge 5% on Ceasefire Hopes
Brent crude futures tumbled nearly 6% to $98.28 a barrel, while WTI dropped to $87.68 as the prospect of a Middle East ceasefire eased supply disruption fears. The sharp decline marks a significant reversal after Trump cited progress in negotiations and a potential end to the war.
🥇 Gold Rises 2% as Oil Slump Tempers Inflation Fears
Spot gold climbed 1.6% to $4,548.07 as the cooling of energy prices reduced concerns over persistent, war-driven inflation. Despite the de-escalation signals, bullion remains well-supported as a hedge while Washington works to formalize a proposal to end the regional conflict.
🌏 Asia-Pacific Stocks Surge on De-escalation News
Regional markets rallied Wednesday, led by a 2.87% jump in the Nikkei 225 and a 1.59% gain in the Kospi, following President Trump’s suggestion of potential talks with Iran. However, Pop Mart plunged 23% in Hong Kong despite record revenue, highlighting a disconnect between earnings and investor expectations.
⚖️ Currency Markets Drift Amid Peace-Plan Skepticism
The euro and British pound edged up slightly as traders remained cautious regarding the U.S. efforts to broker an Iran peace deal. While equities rallied, currency markets moved sideways as Fed funds futures continue to price in a higher chance of rate hikes due to previous war-induced inflation.
💻 Nvidia Edges Higher Despite Triple Pressure
Nvidia shares rose 1% in overnight trading, buoyed by the broader market rebound following peace talk signals. The gain comes even as the chipmaker faces a "triple threat" of insider selling, a Senate probe, and weak price action that has kept retail sentiment largely gloomy.
📉 Microsoft Gap Hits Widest Level Since 2008 Crisis
Microsoft shares are now 33% below their 52-week high, creating the widest gap between its price and 200-day moving average since the Great Financial Crisis. Despite being the worst performer of the "Magnificent Seven," retail sentiment on Stocktwits has flipped to bullish, with many eyeing a "generational opportunity."

One Loss Can Trigger Ten Bad Trades
A loss hits… and suddenly you want it back.
You take another trade. Then another. Not because the setup is clear, but because the feeling is strong. The focus shifts from following a plan to fixing the loss.
That’s where damage builds.
In fast-moving markets, one emotional decision can quickly turn into several. Small losses stack. Position sizes increase. Discipline fades. What started as one mistake becomes a chain of impulsive trades.
Strong traders pause after a loss. They step away. They reset before taking another position. They understand that protecting their mindset is just as important as protecting their capital.
When you break the cycle, your trading becomes calmer. You stop reacting. You start executing.
Control protects consistency.
Some traders like learning from different market perspectives and ideas.
If that’s you, you can explore a few newsletters here:

Tweezer Bottom
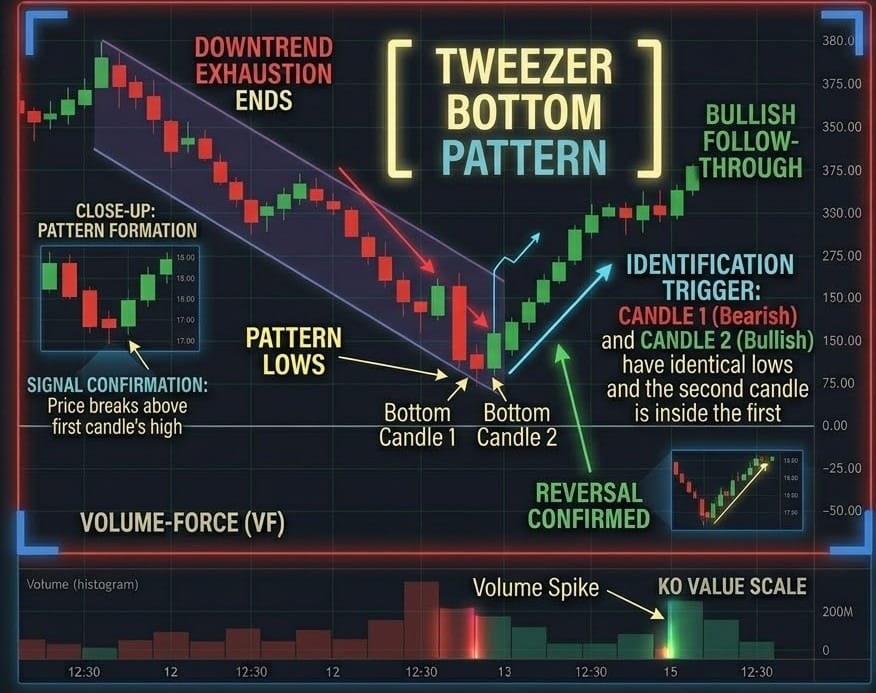
A Tweezer Bottom is a two-candle bullish reversal pattern that appears at the end of a downtrend. It consists of two or more candlesticks with matching (or very near-matching) lows.
The first candle is typically bearish, and the second is bullish. It visualizes a "Wall of Support"—a specific price level where the bears tried to push through twice and failed both times, signaling that the downward momentum has hit a hard floor.
🛠️ The Strategy Logic
Use these logical triggers to identify when a "double-bottom" at the micro-level is signaling a major trend change:
- IF: Two consecutive candles have identical (or near-identical) lows after a decline...
- THEN: The pattern is valid. This shows that the market has found a "zero-tolerance" zone for lower prices. The bears have lost their ability to create a "Lower Low."
- THEN: The pattern is valid. This shows that the market has found a "zero-tolerance" zone for lower prices. The bears have lost their ability to create a "Lower Low."
- IF: The Tweezer Bottom forms at a major horizontal support level or the Lower Keltner Channel...
- THEN: You have a "High-Conviction Reversal." The structural support provides the "Base," and the Tweezer provides the visual proof that the base is being defended by big buyers.
- THEN: You have a "High-Conviction Reversal." The structural support provides the "Base," and the Tweezer provides the visual proof that the base is being defended by big buyers.
- IF: The second candle of the Tweezer is a bullish Hammer or Dragonfly Doji...
- THEN: The signal is reinforced. Not only did the price stop at the same level, but the second candle shows a violent rejection of those lows, suggesting an explosive move upward is coming.
- THEN: The signal is reinforced. Not only did the price stop at the same level, but the second candle shows a violent rejection of those lows, suggesting an explosive move upward is coming.
- IF: The next candle closes above the highs of the Tweezer candles...
- THEN: The reversal is confirmed. This is your "Trigger" to enter a long position. It proves that the "floor" held and the bulls are now actively pushing the price into a new recovery phase.
- THEN: The reversal is confirmed. This is your "Trigger" to enter a long position. It proves that the "floor" held and the bulls are now actively pushing the price into a new recovery phase.
- IF: The Volume Oscillator shows a spike on the second candle...
- THEN: The "Absorption" is complete. High volume on the matching low suggests that buyers have "soaked up" all the remaining sell orders, clearing the path for an uptrend.
💡 Pro Tip
The "Wick" Secret: While the "bodies" of the candles don't have to match, the wick lows must be within a very tight range (usually within a few pips or cents of each other) to be a true Tweezer.
If the second candle’s low is significantly higher than the first, it’s just a standard bullish move. But if they match exactly, it represents a Liquidity Trap—the bears thought they were breaking down, but they were actually being lured into a trap set by institutional buyers.
Always place your stop-loss just 2–3 ticks below the matching lows.

The Open Tab Chaos

A trader sits down to start the session.
Charts open everywhere.
EUR/USD. GBP/USD. Gold. Nasdaq. Bitcoin. Oil.Five timeframes on each.Indicators layered across all of them.
Everything is moving.
Something is always setting up.
So attention starts jumping.
A level on gold looks interesting…Then Bitcoin spikes…Then Nasdaq breaks structure…Then EUR/USD hits a zone…
Now the mind is split across six different narratives.
No single idea gets full focus.
TOO MANY CHARTS = TOO LITTLE CLARITY.
At first it feels like an advantage.
More markets = more opportunities.
But in reality?
More markets = more noise.
You start seeing almost setups everywhere.You rush decisions because something else might move.You enter trades without fully thinking them through.
And even when you’re in a trade…
Your attention drifts.
You’re managing a position on one chart while scanning three others.
That’s how mistakes slip in.
Wrong position size.Missed invalidation.Late exits.
Not because you lack skill.
But because your focus is fragmented.
DEPTH CREATES EDGE.SCATTERING DESTROYS IT.
Professional traders don’t try to watch everything.
They narrow down.
Fewer pairs.Fewer setups.Clear watchlists.
They know their markets.
How they move.When they move.What conditions matter.
That familiarity builds confidence and speed.
The more you reduce, the sharper your decisions become.
Because trading isn’t about catching every move.
It’s about executing your move with precision.
So instead of asking,“What else is moving?”
Ask:“What do I actually trade well?”
Close the extra tabs.
Because the market rewards clarity — not coverage.
And the trader who sees less…
often executes far better.