
MetaX Rips 700% Debut
....................................................................................................................


Good morning!
Wednesday opens with the market still trying to read between the lines and not liking what it sees.
Futures are edging lower after another uneven session, as traders wrestle with a jobs report that managed to say two opposite things at once: hiring came in hotter than expected, while unemployment quietly climbed to its highest level in years. In a normal week, that might be clarifying. After a long data blackout, it’s just added noise.
Rate-cut expectations haven’t budged much, but confidence has. Investors are now forced to weigh flawed data, mixed signals from the labor market, and a Fed that’s clearly not aligned internally. With key Fed speakers on deck today and inflation data landing tomorrow, positioning has turned cautious — especially in tech, where the AI trade is being tested earnings by earnings.
The market isn’t panicking.
It’s pausing — waiting for cleaner data and a clearer story before choosing its next move.

📉 Stocks Retreat as Investors Digest Soft Jobs Data and Tech Rotation
U.S. markets moved sideways as stronger-than-expected unemployment and mixed economic signals kept traders cautious, with the Nasdaq eking out small gains while the Dow and S&P 500 lagged. Get live updates here.
🏛️ Nasdaq Asks SEC to Extend Trading to Nearly 24 Hours
Nasdaq has filed with the SEC to allow 23-hour weekday trading, a move aimed at global investors and overnight liquidity — a potential game-changer for U.S. equities.
֎ OpenAI in Early Talks With Amazon for $10B+ Investment
OpenAI is reportedly negotiating with Amazon on a $10 billion-plus investment, potentially leveraging Amazon’s AI chips and cloud infrastructure to fuel growth ahead of a future IPO.
🚀 MetaX Rockets 700% on Debut
MetaX shares exploded on their first day of trading, surging up to ~700 % as local demand for domestic AI chips drives one of the biggest tech IPO gains in China this year.
🚫 Warner Bros. Deal Pressure Builds as Rejection Likely
Warner Bros. is widely expected to reject Netflix’s acquisition offer — a move that’s rattling media stocks and reshaping valuations across entertainment and streaming rivals.
🪙 Gold Rises Toward Record as Traders Watch US Data and Venezuela
Gold rose toward a record as investors looked ahead to US inflation data and monitored escalating tensions in Venezuela. Silver climbed to a fresh peak, and platinum jumped to the highest since 2008.
📈 Dollar Rebounds After Jobs Data Shake Markets
The U.S. dollar bounced back following the latest jobs data, reversing early losses and alleviating some currency pressure as traders adjust rate-cut expectations.

Start Small. Stay Flexible. Keep Going
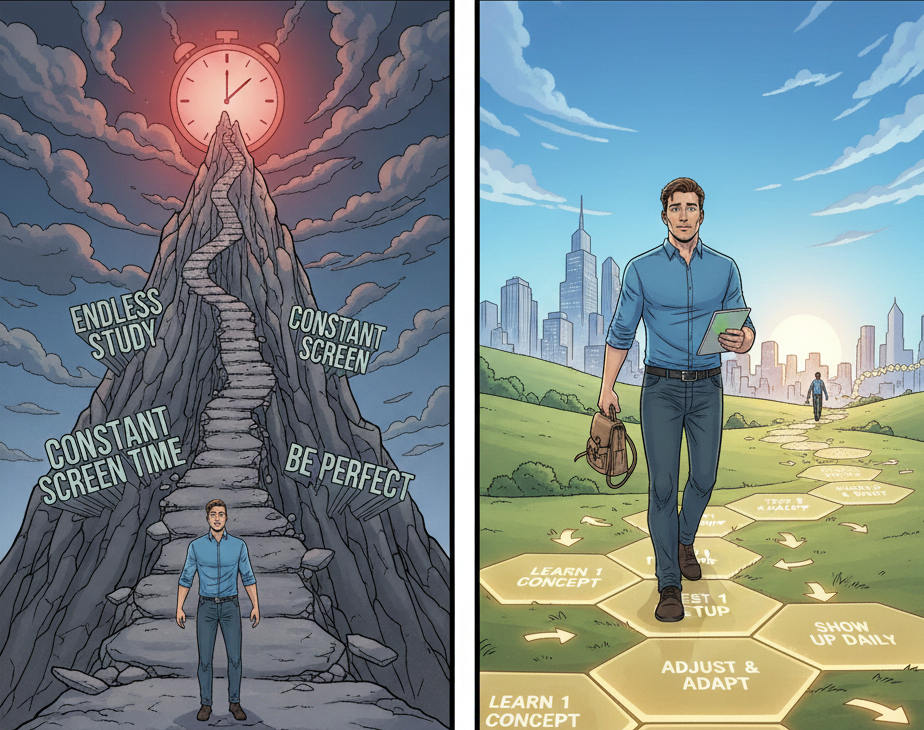
Many people avoid trading because they think it demands a long-term promise. They imagine endless study, constant screen time, and pressure to stay perfect. That belief makes starting feel heavy.
Trading does not require full commitment on day one. You begin with small steps. You learn one concept. You test one setup. You adjust as you gain experience. Flexibility keeps the process sustainable. Progress comes from showing up, not from forcing intensity.
Staying consistent becomes easier when the goal is movement, not mastery. You keep going because the load feels manageable.
If you want guidance that helps you build control over your decisions instead of trying to control the market, these newsletters break down clear, repeatable steps to follow.

Diamond Bottom
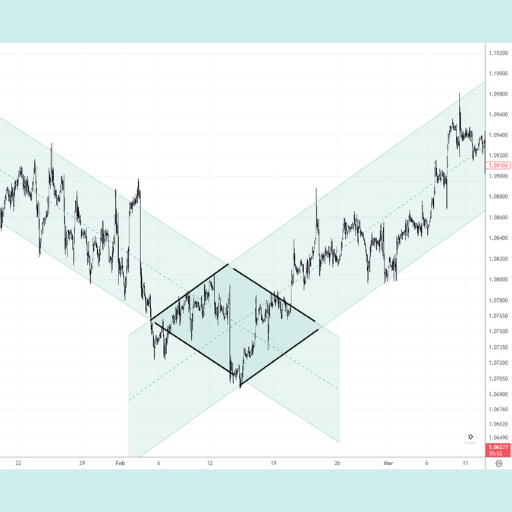
The Diamond Bottom is a rare but highly reliable bullish reversal chart pattern that forms at the end of a prolonged downtrend.
It signals a major shift from selling pressure to buying momentum. Its structure is unique, representing a "chaos-to-order" transition: it begins with an expanding phase (higher highs and lower lows) that reflects market panic and high volatility, followed by a contracting phase (lower highs and higher lows) as the market stabilizes and builds pressure.
When trend lines connect these four outer points, the resulting shape is a diamond or rhombus.
What to Look For:
The Diamond Bottom is often compared to an Inverse Head and Shoulders pattern but with a more complex, symmetrical structure.
- Prior Downtrend: The pattern must occur after a clear, sustained downward move. This context is essential to classify it as a reversal.
- The Broadening Phase (Left Side): Volatility increases as the price makes two or more lower lows and higher highs. This represents the final struggle where bears try to push lower but bulls start fighting back aggressively.
- The Contracting Phase (Right Side): Volatility decreases as price swings narrow into higher lows and lower highs. This "coiling" effect indicates that the market has found equilibrium and is preparing for a directional breakout.
- Volume Profile: Volume typically follows the volatility:
- Spikes during the broadening phase as emotional trading peaks.
- Decreases significantly during the contracting phase as the market consolidates.
- Surges on the breakout, providing the final "truth serum" that the reversal is legitimate.
- Bullish Confirmation (Breakout): The pattern is confirmed when the price breaks decisively above the upper-right resistance trend line. Traders typically look for a candle to close above this line to avoid "fake-outs."
- Stop-Loss Placement: A common conservative stop-loss is placed just below the lowest point of the diamond. A tighter stop-loss can be placed below the most recent swing low within the contracting phase.
- Target Price (Measured Move): Measure the maximum vertical height of the diamond (from the absolute highest peak to the absolute lowest trough). Add this distance to the breakout point to determine the minimum price target.

The Illusion of Progress
You sit in front of charts for hours.
You switch timeframes.
You scroll symbols.
You tweak indicators.

It feels like work. It feels like progress. It isn’t.
Most traders confuse activity with advancement.
Watching more markets does not sharpen your edge. Taking more notes does not fix execution.
Constant chart hopping often hides a deeper problem. Avoidance.
Real progress in trading looks boring and uncomfortable.
You take fewer trades.
You follow the same rules.
You review losses honestly.
You track mistakes without excuses.
Execution moves the needle. Review builds skill. Adjustment creates growth. Repetition locks it in.
Ask yourself this today.
Did you execute your plan, or did you stay busy to feel productive?
Busyness keeps you entertained. Structure makes you profitable.
Make this a daily check-in.
Show up with intention.
Trade only what fits.
Review what happened.
Adjust one small thing.
Then stop.
Progress does not shout.
It compounds quietly when you respect the process.


