Markets in freefall 🔻🔻🔻
....................................................................................................................


😲 Well, that escalated fast.
The S&P 500 just had its worst week since September, Bitcoin is clinging to $80K like a cat on a slippery ledge, and Ether bulls just got wiped out in a 20% nosedive.
Meanwhile, Trump’s Bitcoin reserve order and fresh tariff drama are throwing gas on the fire -because, apparently, we weren’t stressed enough.
But wait - amid the chaos, Xpeng is out here pitching flying cars and humanoid robots, sending its stock to the moon.
Gold’s creeping toward $3,000 as traders panic, and the ECB just slashed rates to keep Europe afloat.
So, is this the start of a full-blown meltdown, or is this just another market fake-out?
Either way, things are getting wild - and if you’re not paying attention, you’re already behind.Get the crucial updates here👇.

🪂US Markets in Freefall as S&P 500 Suffers Worst Week Since September
US stocks extended their slide following a savage week that crushed the S&P 500, Dow, and Nasdaq. Trump's controversial Bitcoin reserve order and escalating tariff talks have only added fuel to the fire. Will this market crash keep deepening under the pressure?
🤖 Xpeng’s Futuristic Leap Lifts Shares High
The promise of flying cars and humanoid robots is sparking investor excitement at Xpeng, pushing shares to levels not seen since August 2022. Despite the distant earnings timeline for these projects, the stock’s rally underscores strong confidence in its forward-thinking strategy.
📉 Bitcoin Slips to $80K Amid Extreme Market Fear
Bitcoin's volatile ride continues as it drops to just above $80K, sparking warnings from Arthur Hayes of a retest at $78K. With 70% of recent selling from new entrants and the Fear & Greed Index in extreme fear, traders brace for a violent move if it breaches key support levels.
⚠️ Ether’s Bull Run Crumbles in 20% Freefall
Ether just tanked nearly 20% in a week, shattering the bullish trendline built since the Terra crash. With key supports broken, traders now eye the critical $1,500 level - are the bears taking over?
💴 Trade War Turmoil Drags Stocks Down While Yen Gains on Deflation Fears
Investors face uncertainty as U.S. figures dip and Asian indices falter under the weight of Trump’s aggressive tariff moves and China’s deflation concerns. The rally in safe-haven currencies underscores mounting risk—are we headed for deeper global volatility?
🟡 Gold Rallies as Economic Uncertainty Fuels Safe-Haven Flows
Gold edged higher today, buoyed by a weakening dollar and robust safe-haven flows amid global trade tensions and economic uncertainty. With spot gold trading near $2,912 and futures ticking up, analysts see the $3,000 level on the horizon. Could these flows ignite a new bull run in precious metals?
🏦 European Central Bank Cuts Interest Rates as Trade Tensions Mount
In a determined push to stimulate growth, the ECB has lowered rates to 2.5% despite looming US tariffs and rising European military spending. As market reactions spark a stronger euro and bouncing stocks, is this rate cut the lifeline the eurozone desperately needs?

HP Inc. (NYSE: HPQ) - Update
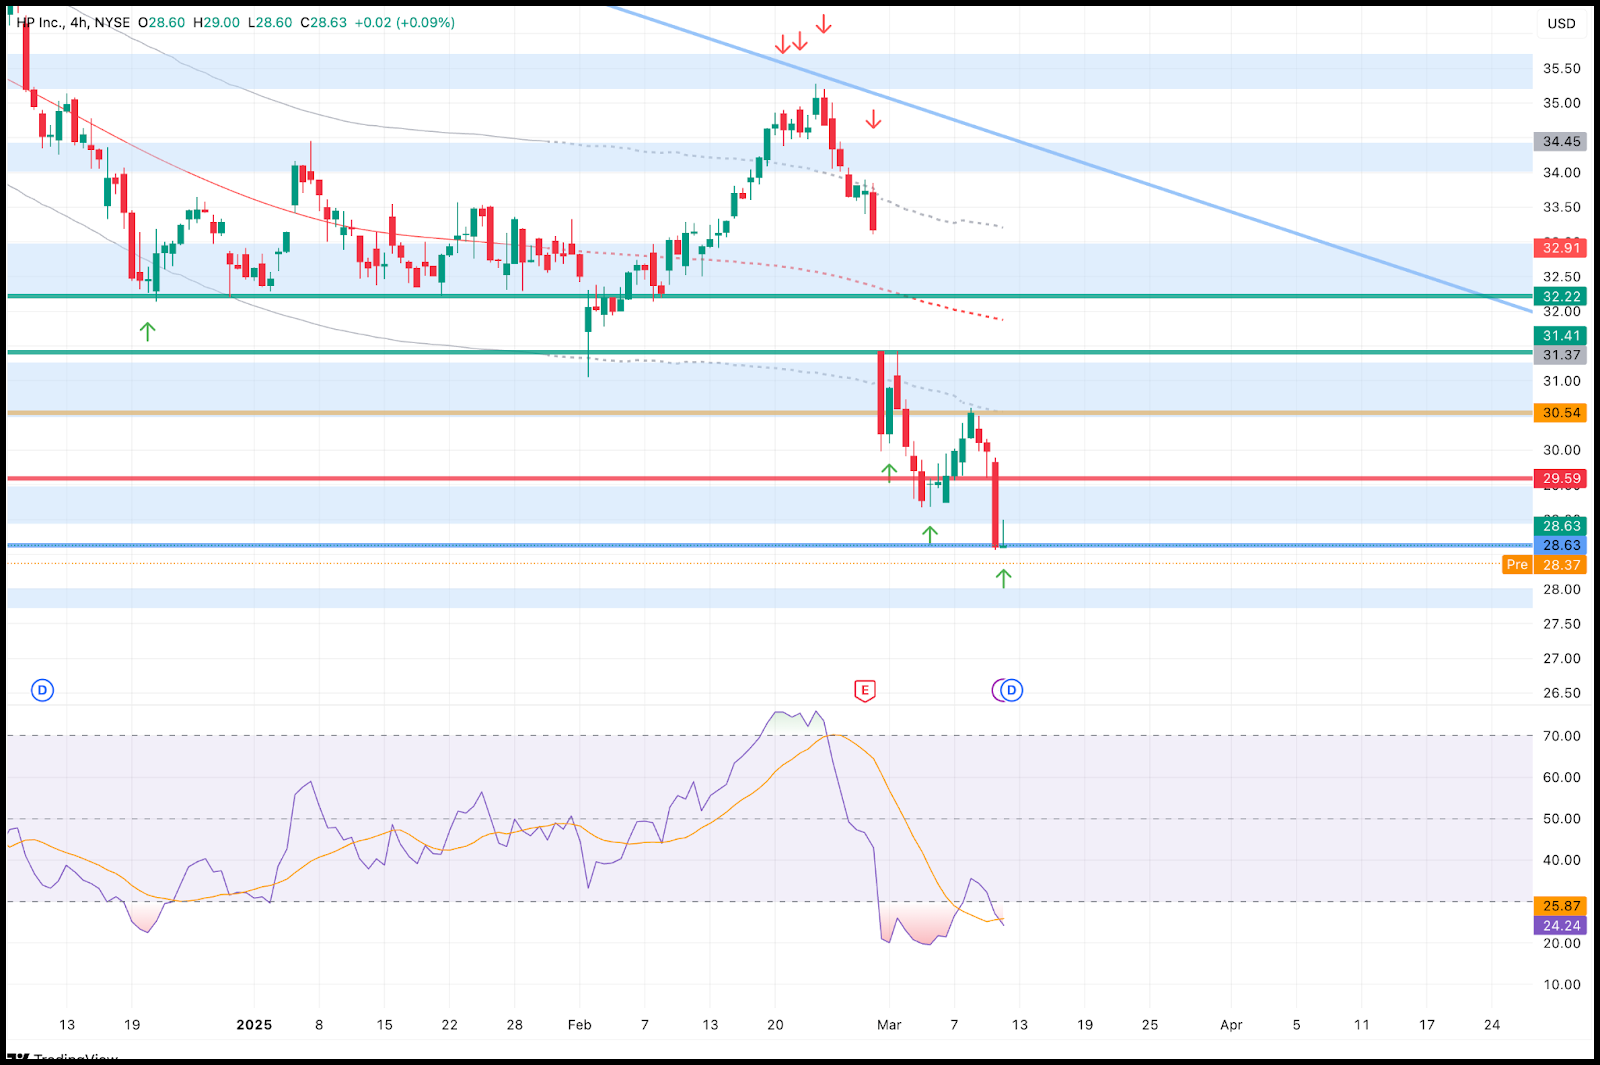
We are recommend a buy for HPQ here.
Price have pull back and it’s still within our plan.
I have added in a 2nd position at $28.63 which will bring our Break Even price to $29.59.

Two Opposite Plays - Recommendations
Today, we’re taking a buy in the casino space and a short in pharmaceuticals - two very different setups, but both offering strong opportunities.
MGM Resorts International (NYSE: MGM)
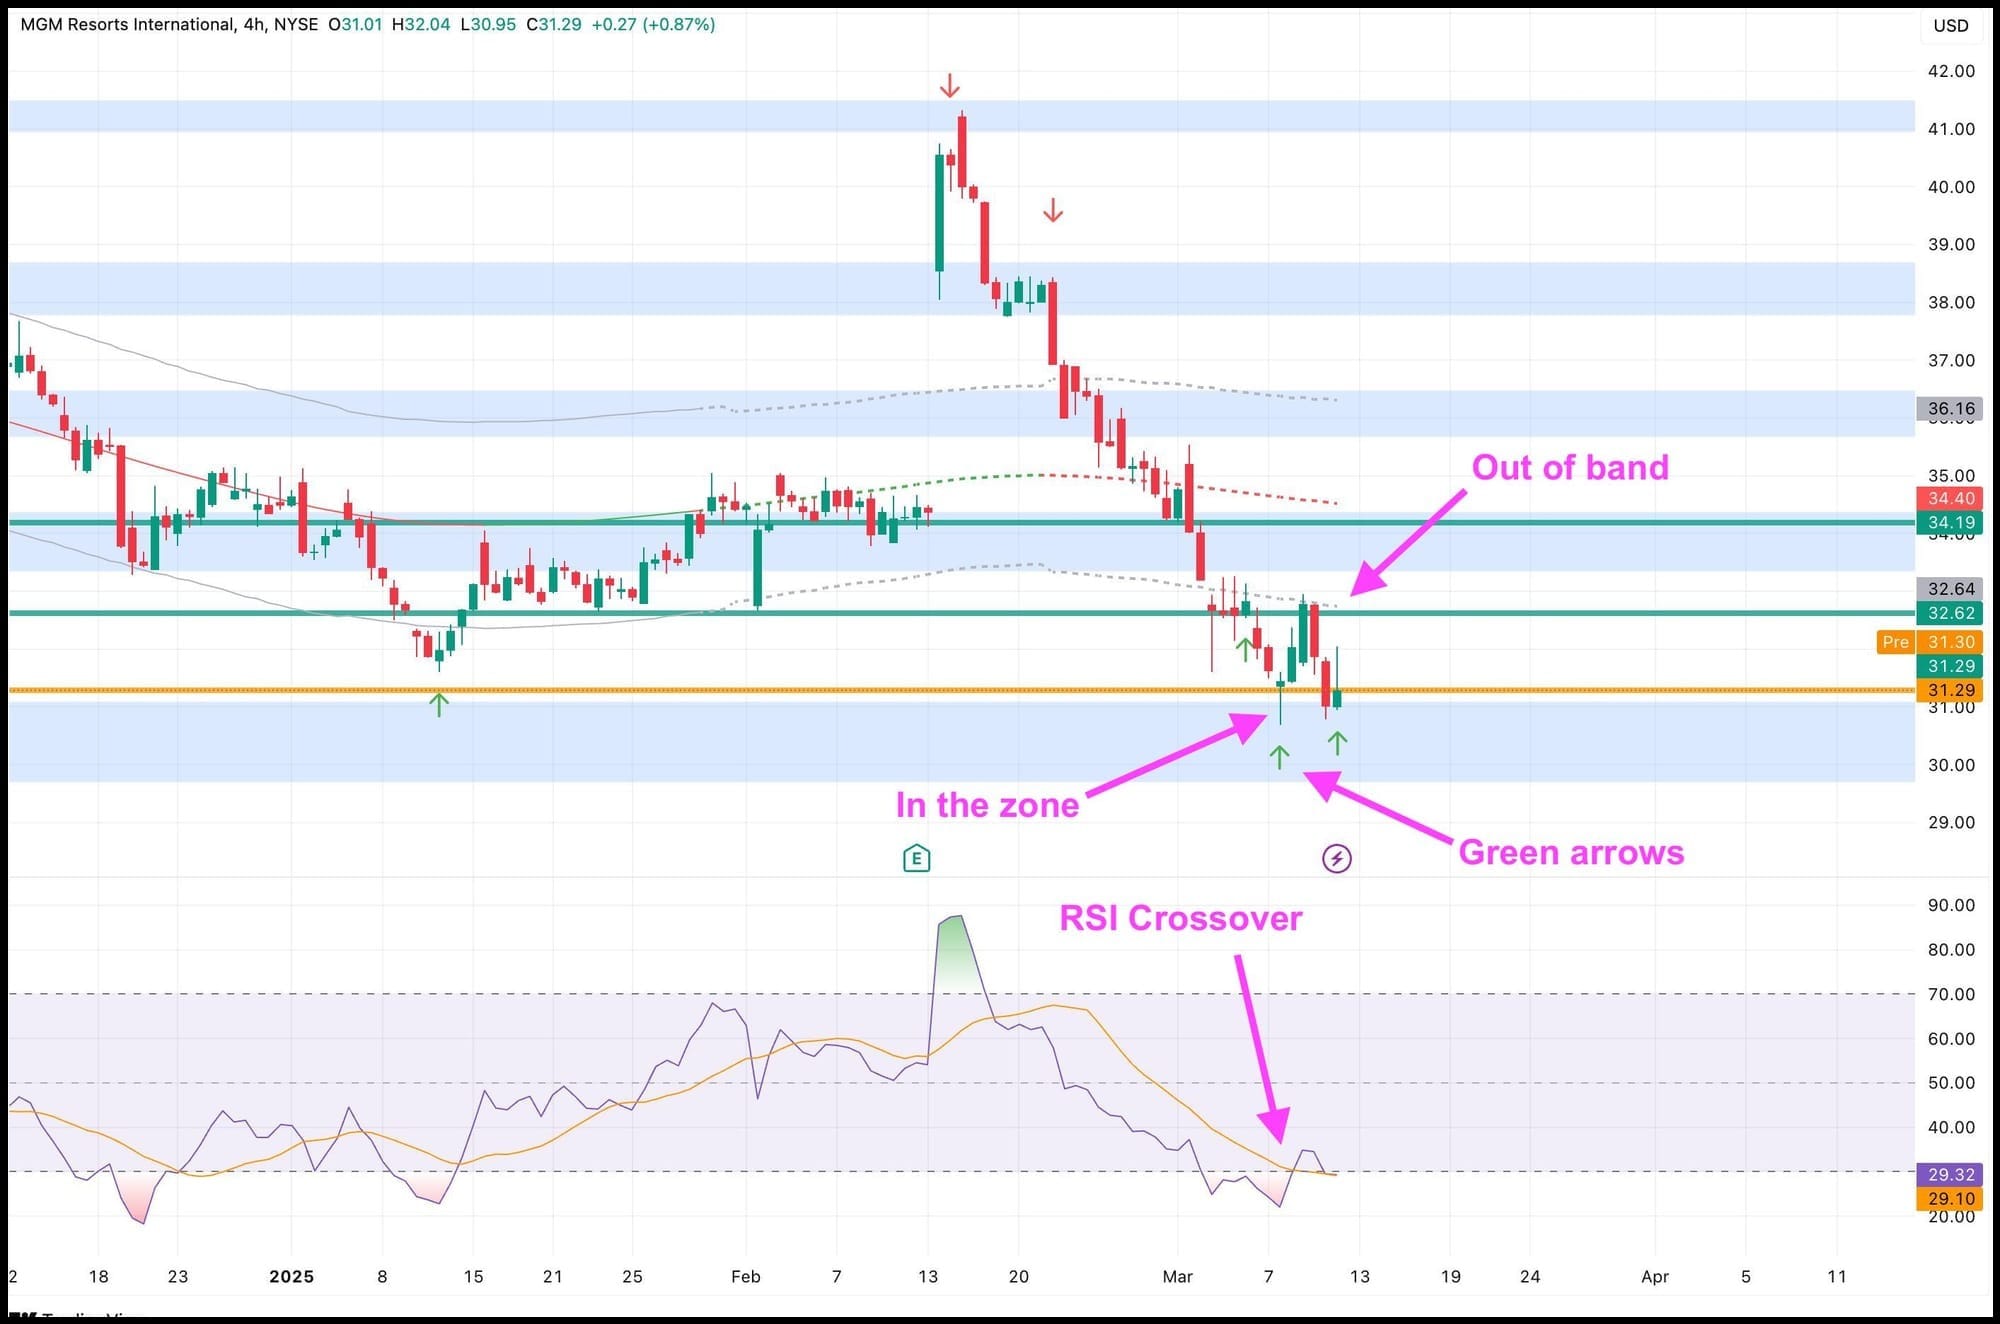
Buying in at $31.29.

MGM has been showing signs of a rebound, and with price sitting at a key support level, buyers are stepping in.
If momentum picks up, we could see a push toward higher levels.
The risk-to-reward looks favorable, making this a trade worth taking.
🎯 Targets:
Buy: $31.29
TP1: $32.62
TP2:$34.19
AbbVie (NYSE: ABBV)
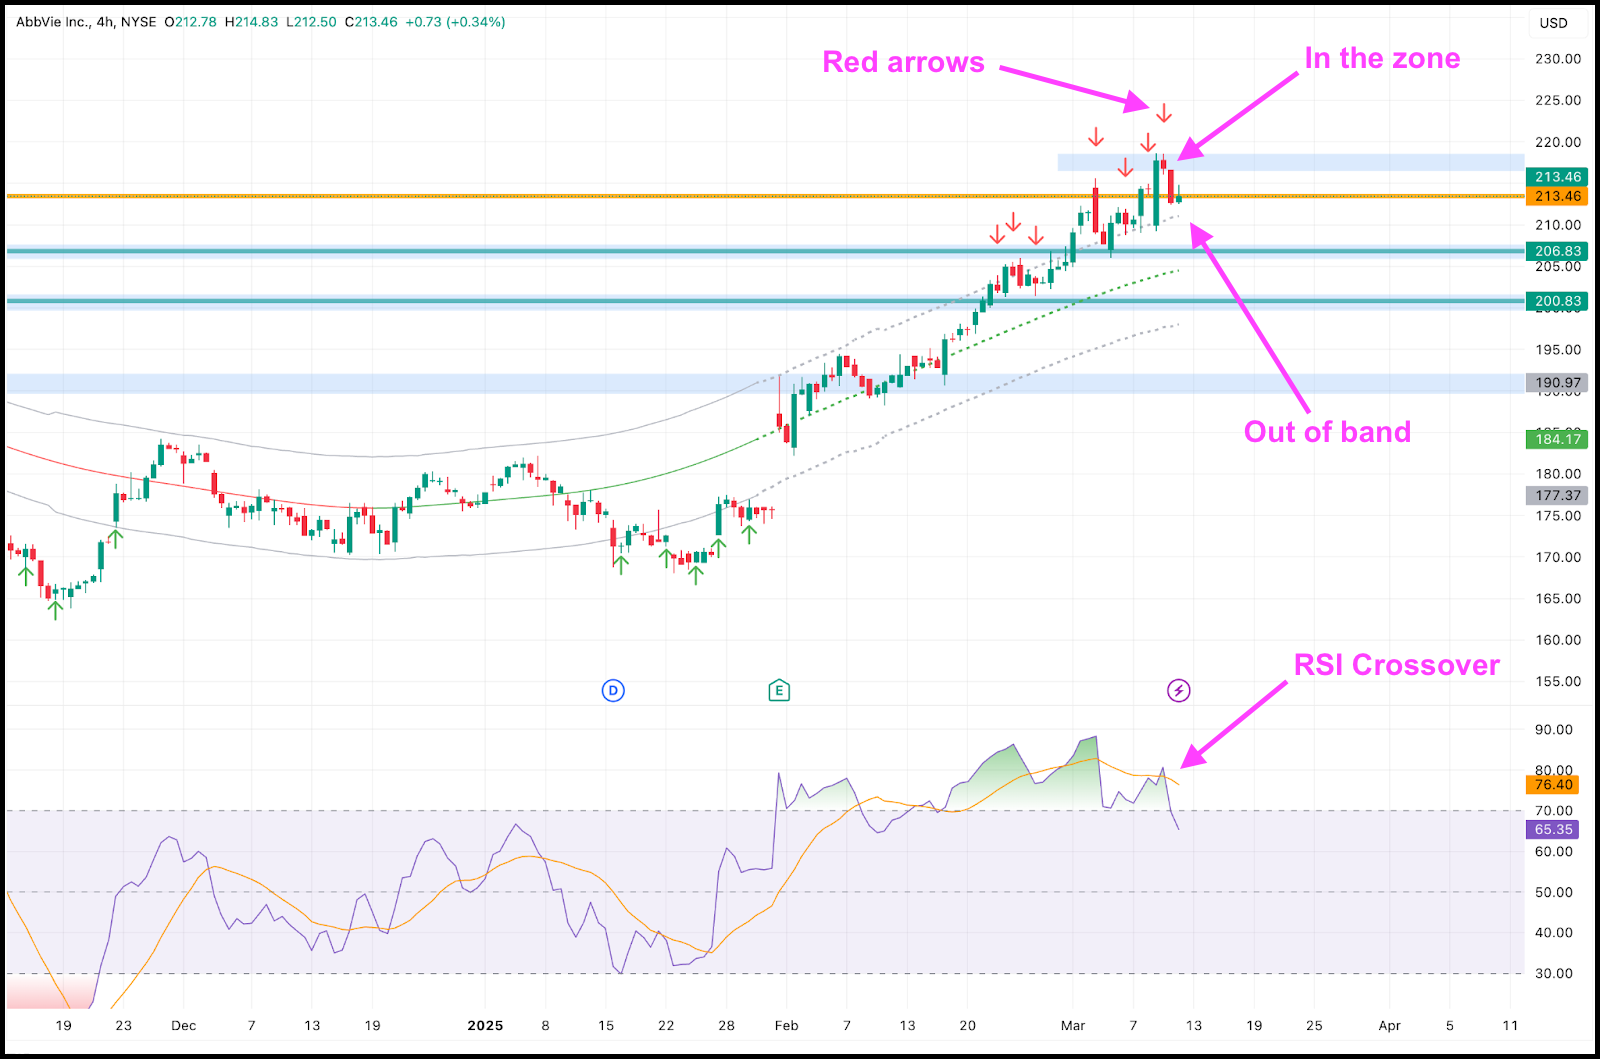
On the other hand, AbbVie is showing signs of cooling off after a strong run.
So I'm diving in for a sell position at $213.46.

The stock is losing momentum, and if support breaks, there’s room for further downside.
We’re stepping in early to capture the move.
🎯 Targets:
Sell: $213.46
TP1: $206.83
TP2: $200.83
One stock looking to climb, another on the verge of rolling over.
Both offer setups we don’t want to miss!
Let's see how this goes.

Think You’re Missing the AI Stock Boom? Here’s How to Get a Front-Row Seat!
If you’ve ever felt like AI stocks take off just as you’re hearing about them, you’re not alone.
Jumping in late can mean watching others cash in while you’re stuck playing catch-up.
But it doesn’t have to be this way.
AI newsletters give you early insights into emerging companies and technologies, so you can spot the opportunities before they hit the mainstream.
Secure your front-row seat to the AI stock boom with these newsletters!

Moving Average Convergence Divergence (MACD)
The Moving Average Convergence Divergence (MACD) is a momentum indicator that shows the relationship between two moving averages of a security's price. It's used to identify changes in the strength, direction, momentum, and duration of a trend.
What to Look For:
- MACD Line and Signal Line Crossovers:
- A crossover of the MACD line above the signal line is considered a bullish signal.
- A crossover of the MACD line below the signal line is considered a bearish signal.
- Centerline Crossovers:
- The MACD line crossing above the zero line indicates bullish momentum.
- The MACD line crossing below the zero line indicates bearish momentum.
- Divergence:
- Divergence between the MACD and price action can signal potential trend reversals. For example, if the price is making higher highs, but the MACD is making lower highs, it could indicate a weakening uptrend.
- Divergence between the MACD and price action can signal potential trend reversals. For example, if the price is making higher highs, but the MACD is making lower highs, it could indicate a weakening uptrend.
- Histogram:
- The MACD histogram shows the difference between the MACD line and the signal line, providing a visual representation of momentum changes.

You don’t need to be a billionaire to think like one.
Be calm. Be calculated. Be Tepper.
Imagine this: you're sitting on billions, your calls can move the market, and hedge fund legends call you for clarity.
That’s David Tepper.
The man who went from working at a credit desk to running one of the most successful hedge funds in history - Appaloosa Management.
But here’s the thing most people don’t talk about:
He didn’t get there by playing it safe or following the crowd.
Tepper is known for buying when everyone else is panicking.
In 2009, when the market was falling apart and most traders were watching their screens through tears, he was loading up on bank stocks - hard.
That one move?
It made his fund nearly $7 billion.
And made him a Wall Street legend.
But his real edge?It wasn’t just the trades. It was the mindset.
“The key in investing is to act when others are afraid. Not because you're reckless—but because you’ve done the work.” — David Tepper
Here’s what that means for you and me, the everyday trader grinding on the screens:
Tepper doesn’t react emotionally to noise. He steps back, zooms out, and waits for the odds to swing in his favor.
When others rush, he pauses.
When others panic, he calculates.
So ask yourself:
- Are you trading to feel something - or to build something?
- Are you reacting to the market - or responding with clarity?
Because if you don’t master your mind, the market will master you.
Tepper doesn’t chase trades - he sets traps. He stays detached, but never disconnected.
The next time fear or FOMO hits you like a freight train, remember:
📉 A great setup means nothing if your mindset is all over the place.
📈 Discipline is what turns chaos into cash.
Have a sharp, focused trading week ahead.
I’m always in your corner.


