
Markets Big Selloff
....................................................................................................................


Good morning!
You ever wake up and feel the market is still trying to remember what just happened yesterday?
That’s exactly where we are this morning.
After the ugliest sell-off in over a month, US futures are basically… hovering. Not bleeding. Not bouncing. Just sitting there, trying to make sense of a narrative that changed overnight. Tech got hit the hardest - the same names everyone worships when the tape is green. Nvidia, Broadcom, Tesla… all took it on the chin. And just like that, yesterday’s “new highs” on the Dow vanished like they never happened.
Here’s the real story though: It’s not about the sell-off - markets sell off all the time.
It’s the confidence wobble around December rate cuts. One day the odds were 95%, and now traders are barely giving it a coin flip. The Fed speakers aren’t helping either - every one of them suddenly sounds like they’ve discovered their inner hawk.
And then there's the weird twist of the week: The government reopens, everyone expects the data firehose to resume… and the White House casually announces a bunch of it may be “permanently impaired.” Great. Because what markets needed right now was less clarity.
So yes - futures are flat, but the mood?
Very much not.

🔓 Shutdown Ends After 43 Days
The U.S. federal government’s shutdown, the longest in history at 43 days, finally ended when President Donald Trump signed a funding bill, resuming operations, restoring pay for 650,000+ workers and halting a data-blackout that clouded markets.
🚀 Futures Surge as Shutdown Deal Clears
Following the Senate’s vote to end the funding impasse, futures for the S&P 500 and Nasdaq‑100 spiked—it looked like markets rushed in expecting relief and a hit-of optimism after weeks of gridlock.
🔄 Siemens Ramps Growth but Stock Falls
Siemens AG raised its medium-term sales growth forecast to 6-9% but disappointed on Q4 profit and guidance - shares still slid nearly 6% as investors questioned execution.
📈 Cisco Soars on AI-Infrastructure Boom
Cisco Systems, Inc. shares jumped ~6–8% in Europe after boosting its FY2026 revenue outlook to US $60.2-61 billion, driven by over US $2 billion in AI-related orders and a pipeline of ~US $3 billion.
🔻 Bitcoin Dips Under US$97K Amid Fed Worries
Bitcoin slipped below US$97,000 as traders grew uneasy about delayed rate cuts and the lingering impact of the shutdown - risk assets got no shelter.
💥 Global Markets Sink on Fed and Macro Fear
Equities worldwide sank as rate-cut hopes faded and macro uncertainty spiked from Asia to Europe, risk sentiment turned, dragging crypto and tech alike.
🔥 Oracle’s US$300B AI Deal Hits Investor Hurdle
Oracle Corporation’s deal with OpenAI - worth roughly US $300 billion in AI infrastructure commitments has triggered investor concern over massive debt, capital intensity and how the bet pays off.

Investing is ownership. Trading is timing.
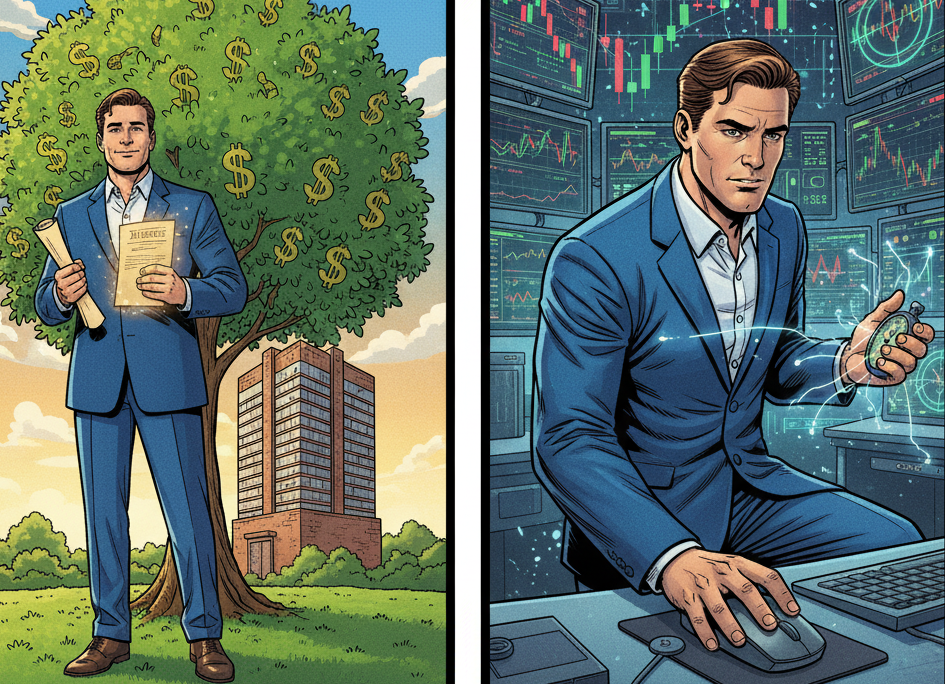
Most people freeze because they mix these two approaches. They wait for the perfect moment to invest or try to treat every trade like a long term bet. That creates confusion and stops action.
Investing is simple. You buy a business for the long run. You focus on value, growth, and stability. You hold through noise because your goal is ownership.
Trading is different. You focus on price movement, structure, and execution. You enter with a clear plan and exit when the setup completes. Your goal is timing, not long term holding.
When you separate the two, decisions become clear. You know why you’re entering, how long you’re staying, and what success looks like. Clarity leads to action.
If you want clear guidance on when to invest and when to trade, these newsletters help. They break down both approaches in simple terms so you avoid mixing rules and start making clean decisions.

Descending Triangle
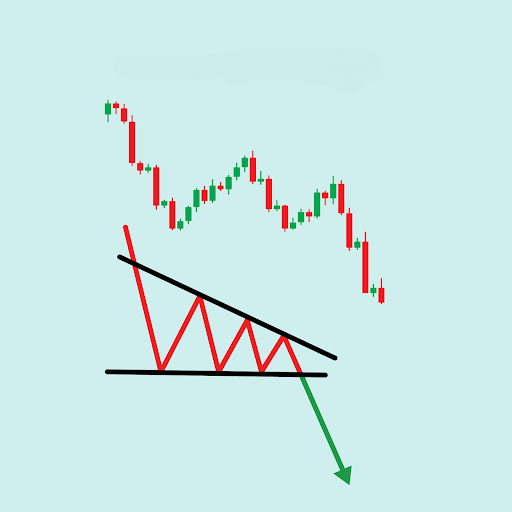
The Descending Triangle is a strongly bearish chart pattern that typically forms during a downtrend, signaling that the price is likely to continue moving downwards after a period of consolidation.
It is characterized by a flat or horizontal lower trend line (support) and a declining upper trend line (resistance). This pattern indicates that sellers (supply) are more aggressive than buyers (demand).
The horizontal support shows consistent buying at the same price, but the descending resistance shows that sellers are willing to step in at increasingly lower highs, building pressure for a breakdown.
What to Look For (Key Features and Signals)
- Pattern Shape: The pattern is formed by a flat lower line connecting two or more lows at roughly the same price level, and a downward-sloping upper line connecting two or more descending highs.
- Implied Direction: It carries a strong bearish bias. The declining resistance line confirms that sellers are consistently willing to sell at lower prices, which compresses the price against the firm support level.
- Volume Trend: Trading volume should generally decrease as the price consolidates within the triangle, reflecting a period of quiet distribution. This is healthy consolidation.
- Breakout Confirmation: The pattern is confirmed when the price breaks decisively below the flat, horizontal support line. This breakdown should be accompanied by a noticeable spike in volume to validate the strong shift from consolidation back to the active downtrend.
- False Breakout Check: Be careful of the price briefly dipping below the support line only to snap back (a false breakout or "fake-out"). Wait for a candle to close clearly outside the triangle to confirm the breakdown's validity.
- Target Price: The traditional price target is calculated by measuring the height of the triangle at its widest part (the base) and projecting that distance downward from the breakdown point.

The “Next Trade” Fallacy
Many traders fall into the trap of believing the next trade must fix everything.

One loss hurts, and suddenly the next position becomes a rescue mission.
That pressure turns a small problem into a major one.
When you expect a single trade to redeem you, you stop thinking in probabilities.
You stop following your plan.
You stop respecting risk.
The trade becomes emotional.
You size up too much.
You rush the entry.
You ignore the signal.
You chase the feeling of being right instead of focusing on being consistent.
That is how a paper cut becomes a bullet wound.
The market didn’t do it. The reaction did.
A single trade never defines you.
A series of disciplined decisions does.
Progress in trading comes from stacking small, controlled wins and small, controlled losses.
No urgency. No heroics. No pressure to prove anything.
Your only job after a loss is to reset your mind.
Slow everything down.
Return to your process.
Take the next trade when it meets your rules, not your emotions.
You don’t need the next trade to fix anything.
You need the next trade to be clean.


