Iran Threatens US Tech
....................................................................................................................


Good morning.
The stock market is trying to stage a comeback, but President Trump just changed the entire script.
We’re opening this Easter-shortened week with a bit of a relief bounce—Nasdaq and S&P futures are up 0.4% but don't let the green fool you. After five straight weeks of losses and the Dow officially sliding into correction territory, the vibe is less "recovery" and more "bracing for impact."
Trump isn't just looking for a ceasefire anymore; he’s looking for the deed. Over the weekend, he told the Financial Times his preference is to simply "take the oil" and control Iran’s energy industry indefinitely. While he claims Tehran has already folded on most of his demands, the oil pits aren't buying the "peace" story yet. Brent crude just spiked 3% to $108, and WTI is back above the $100 mark. It’s a bold, "TACO-style" playbook that has everyone wondering if we're looking at a resolution or a permanent occupation.
The "Magnificent Seven" aren't looking so magnificent lately. Big Tech just watched $850 billion in market cap vanish in a single week. Meta and Google are leading the retreat after losing a massive lawsuit over social media addiction, proving that even AI darlings aren't immune to the legal hammer.
This week is a sprint to the finish. We’ve got a massive pile of jobs data—JOLTS, ADP, and the March Payrolls report—all packed into a week that ends early for Good Friday. Investors are desperate for a sign that the labor market isn't cooling as fast as the Middle East is heating up.
It’s a "watch the headlines" Monday.
With Nike earnings on deck to check the pulse of the consumer, we're about to find out if this bounce has legs or if the "take the oil" rhetoric is going to set the market on fire again.

⚠️ Iran Threatens "Legitimate" Attacks on Nvidia, Apple, and Google
The IRGC has designated 18 U.S. tech giants as targets for retaliation, warning employees to evacuate workplaces by 8 p.m. Tehran time (10:30 a.m. ET) Wednesday. The threat against companies like Microsoft and Nvidia comes as the IRGC cites "legitimate targets" following U.S. and Israeli strikes on Iran.
📈 Futures Rise After Brutal Quarter as Trump Signals Exit
U.S. stock futures climbed Tuesday night as President Trump suggested military forces could leave Iran in "two or three weeks." The bounce follows the S&P 500’s worst quarter in a year and the Nasdaq’s weakest performance since 2022, with investors desperately seeking signs of de-escalation.
🇰🇷 Samsung Surges 13% in Best Day Since 2001
South Korean stocks staged a historic rebound, with the Kospi closing 8.4% higher as hopes for an end to the Iran war revived risk appetite. Samsung Electronics soared 13%, its biggest single-day gain in over two decades, while SK Hynix jumped 11%, briefly triggering a halt in program trading.
🛢️ Oil Seesaws Near $100 as Trump Declares Victory
Crude prices fell over 2% in volatile trading after President Trump appeared to declare victory, stating he expects U.S. troops to exit Iran shortly. Brent crude slipped to $101.66, while WTI dropped to $98.83 as the market weighed the prospect of a rapid military withdrawal against IRGC threats.
📉 Nvidia Ends Q1 Below Key 200-Day Average
In a surprising reversal, Nvidia stock tanked 7.6% during the first quarter, underperforming the major averages. Shares of the AI darling ended the period below their psychologically critical 200-day moving average, marking a rare "speed bump" for the high-flying semiconductor giant.
👟 Nike Tumbles Toward 9-Year Low on Soft Outlook
Shares of Nike are approaching decade lows after the company forecast a sales decline through the end of 2026. Despite the weak guidance, retail traders on social platforms are reportedly "scooping up" shares, betting that the current valuation represents a generational entry point.
☁️ Microsoft to Invest $5.5B in Singapore AI Hub
Microsoft is moving ahead with plans to spend $5.5 billion on cloud and AI infrastructure in Singapore through 2029. The massive capital commitment underscores the company’s focus on global expansion, even as it faces mounting geopolitical threats and domestic selling pressure.

Small Losses Turn Big When You Don’t Cut Them
A trade goes against you… but you hold.
You tell yourself it will come back. You give it more room. You avoid closing because taking the loss feels worse than staying in it.
That’s where the real damage starts.
Small losses are manageable. Large losses are not. When you refuse to cut early, risk grows silently. One position can go from controlled to account-threatening before you react.
This is not a strategy problem. It’s a mindset problem.
Strong traders accept losses quickly. They define risk before entering. If the trade is wrong, they exit without hesitation. No hope. No delay.
They understand that taking a small loss is part of staying in the game.
When you learn to cut losses early, your account becomes more stable. You protect your capital. You give yourself the chance to keep trading.
Discipline keeps losses small.
Some traders like learning how others manage risk and think through difficult decisions.
If that’s you, you can explore a few market reads here:

Sine Wave Indicator
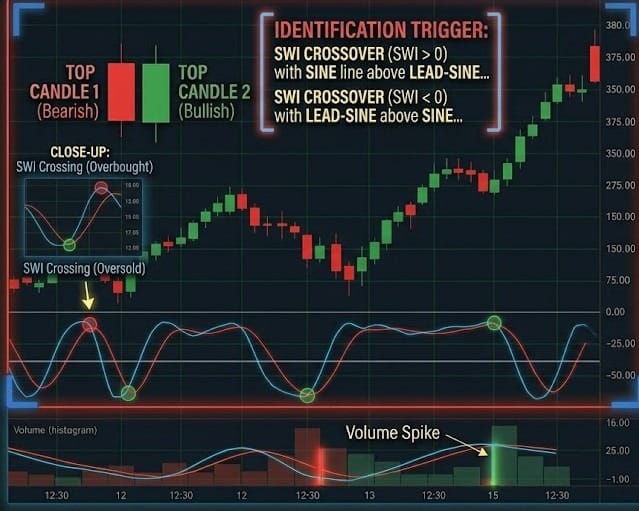
Developed by John Ehlers, the Sine Wave indicator is a sophisticated tool designed to determine if the market is in a cycle mode or a trend mode.
Unlike standard oscillators, it uses two lines—the Sine (blue) and the Lead-Sine (red)—that cross each other like a DNA strand.
It is specifically engineered to predict turning points in sideways markets and warn you when a trend is too strong for "swing trading" logic.
🛠️ The Strategy Logic
Use these logical triggers to distinguish between a "bouncing" market and a "trending" breakout:
- IF: The Lead-Sine line (red) crosses above the Sine line (blue)...
- THEN: A cyclical bottom has been reached. In a non-trending market, this is a high-probability "Buy" signal, suggesting the price is about to swing toward the upper boundary of its current cycle.
- THEN: A cyclical bottom has been reached. In a non-trending market, this is a high-probability "Buy" signal, suggesting the price is about to swing toward the upper boundary of its current cycle.
- IF: The Lead-Sine line crosses below the Sine line...
- THEN: A cyclical top has been reached. This signals a "Sell" or profit-taking exit, indicating that the current upward swing has exhausted its mathematical momentum.
- THEN: A cyclical top has been reached. This signals a "Sell" or profit-taking exit, indicating that the current upward swing has exhausted its mathematical momentum.
- IF: Both the Sine and Lead-Sine lines start moving parallel to each other (not crossing)...
- THEN: The market has entered a Trend Mode. In this state, the Sine Wave "breaks," and its crossover signals become false. This is a critical warning to stop using mean-reversion strategies and switch to trend-following tools like Keltner Channels.
- THEN: The market has entered a Trend Mode. In this state, the Sine Wave "breaks," and its crossover signals become false. This is a critical warning to stop using mean-reversion strategies and switch to trend-following tools like Keltner Channels.
- IF: The price is making new highs, but the Sine Wave lines are flat or declining...
- THEN: The market cycle is "decaying." Even if the price is drifting higher, the mathematical regularity of the move is gone. This often precedes a "clatter" or a messy period of price action with no clear direction.
- THEN: The market cycle is "decaying." Even if the price is drifting higher, the mathematical regularity of the move is gone. This often precedes a "clatter" or a messy period of price action with no clear direction.
- IF: A crossover occurs exactly at the 1 or -1 extreme levels...
- THEN: The signal is high-conviction. When the lines cross at the very edges of the indicator's range, it suggests the cycle has reached its maximum "stretch" and a sharp reversal to the mean is imminent.
💡 Pro Tip
The "Trend-Killer" Secret: The Sine Wave’s greatest strength is its ability to tell you when not to trade. If the lines are not crossing and look like they are "running away" from each other (parallel), the market is trending so hard that oscillators will fail.
Only trade the Sine Wave crossovers when the lines look like a smooth, winding "S" shape. If the "S" turns into a "straight line," put your swing-trading ego aside and wait for the market to return to a cycle before trusting the indicator again.

The Strategy Hopping Spiral

You take two losses.
Nothing unusual. Just part of trading.
But your brain doesn’t see it that way.
It starts asking questions.
“Is this strategy still working?”
“Maybe the market has changed.”
“I should try something else.”
So you switch.
New indicators.New rules.New entries.
For a moment, it feels like progress.
Like you’re adapting.
But a few trades later?
Another loss.
And the cycle repeats.
THIS ISN’T ADAPTATION.IT’S AVOIDANCE.
You’re not refining a system.
You’re running from discomfort.
Every strategy has losing streaks.Every edge has drawdowns.
But when you switch too early, you never stay long enough to see the edge play out.
CONSISTENCY NEVER FORMS.
Your data resets.Your confidence resets.Your learning resets.
You become a beginner… over and over again.
That’s the spiral.
You keep searching for a strategy that never loses.
It doesn’t exist.
So instead of mastering one system, you collect fragments of many — and none of them stick.
Professionals don’t chase new strategies after a few losses.
They zoom out.
They review:
Was the setup valid?
Was the execution clean?
Was the risk managed correctly?
If the answer is yes, they continue.
Because they understand something critical:
EDGE PLAYS OUT OVER SERIES — NOT SINGLE TRADES.
Adapting is not emotional.
It’s data-driven.
It happens after:
- A meaningful sample size
- Clear breakdown in performance
- Structured review
Not after two red trades and a bad mood.
So here’s the shift:
Stop asking,“Is this strategy broken?”
Start asking,“Have I given it enough time to prove itself?”
Because the trader who keeps switching never builds belief.
And without belief, execution will always collapse under pressure.
Mastery comes from depth — not constant change.