Investors camping here! ⛺
....................................................................................................................


AI stocks are in the spotlight again - Nvidia’s down 5% in 2025, but investors?
They’re still crazy bullish.
Palantir just hit an all-time high, and analysts say there’s even more upside.
Could it double from here?
The wild card?
Trump’s newly announced 25% tariff on all steel and aluminum imports and this time no one is spared. One policy move, and everything could flip upside down.
And Bitcoin? Still below $100K, shaking up sentiment - but die-hard believers aren’t blinking.
Markets are moving fast, and if you blink, you might miss something big. But don’t worry - We've got the crucial updates lined up.
Let’s dive in.

🔥 AI Stock: Palantir Hits Record High!
Palantir stock soared to a new all-time high last week, fueled by a strong 2025 outlook and AI integration. Analysts have raised price targets, and technicals suggest a long-term uptrend. Could PLTR double from here?
🕵️♂️ Hidden AI Stocks Set for Big Growth!
Tech giants just took a hit, but some investors see a goldmine. DeepSeek’s R1 model shook up markets, sparking fears of a major AI disruption. But top analysts say this isn’t a crash - it’s an opening for AI’s next big winners.
🦾 BB.AI Stock Ready to Skyrocket?
BB.AI’s breakthrough AI is rewiring entire industries - from healthcare to finance. Investors are piling in, betting on its blazing-fast algorithms to reshape the market.
🪙 Bitcoin Slides Again After Trump’s Tariff Threat
Trump just announced a 25% tariffs on steel and aluminum, sending shockwaves through global markets. Bitcoin tumbled to $94K before clawing its way back over $97K. With more tariffs on the table, is crypto in for a wild ride ahead?
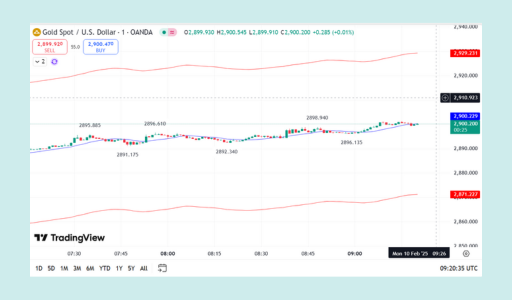
👑 Gold Smashes New Record - $2,897 and Climbing!
Gold just hit another all-time high, fueled by Trump’s tariff bombshell and inflation fears. Safe-haven demand is surging as investors brace for economic uncertainty. With $2,900 in sight, how high can gold go?
💲 Dollar Rises as Euros Nears a Two-Year Low
Trump's 25% tariff threats are shaking markets - sending the dollar higher while the euro hovers near a two-year low. Trade war jitters are back, and investors are watching the Fed.
📉 S&P 500 Futures Drop as Trump Teases Tariff
Markets brace for impact as Trump plans tariffs on “everyone.” Futures slide, Amazon plunges 4%, and traders fear an all-out trade war. Will today’s tariff shake up Wall Street even more?

Before diving into today’s setups, a quick reminder.
I’m still holding onto some positions from the last update as we wait for them to play out.
Momentum Shift: Atlassian & ADP Breaking Formation
We’re locking in on two stocks that are flashing clear signals.
One is struggling to hold its ground, while the other has already broken key technical levels, setting up a potential downside move.
Here’s what’s on the radar:
Atlassian Corporation (NASDAQ: TEAM)
Atlassian is hitting a ceiling, and buyers aren’t stepping up.
Let's go in for a sell position at $314.91.
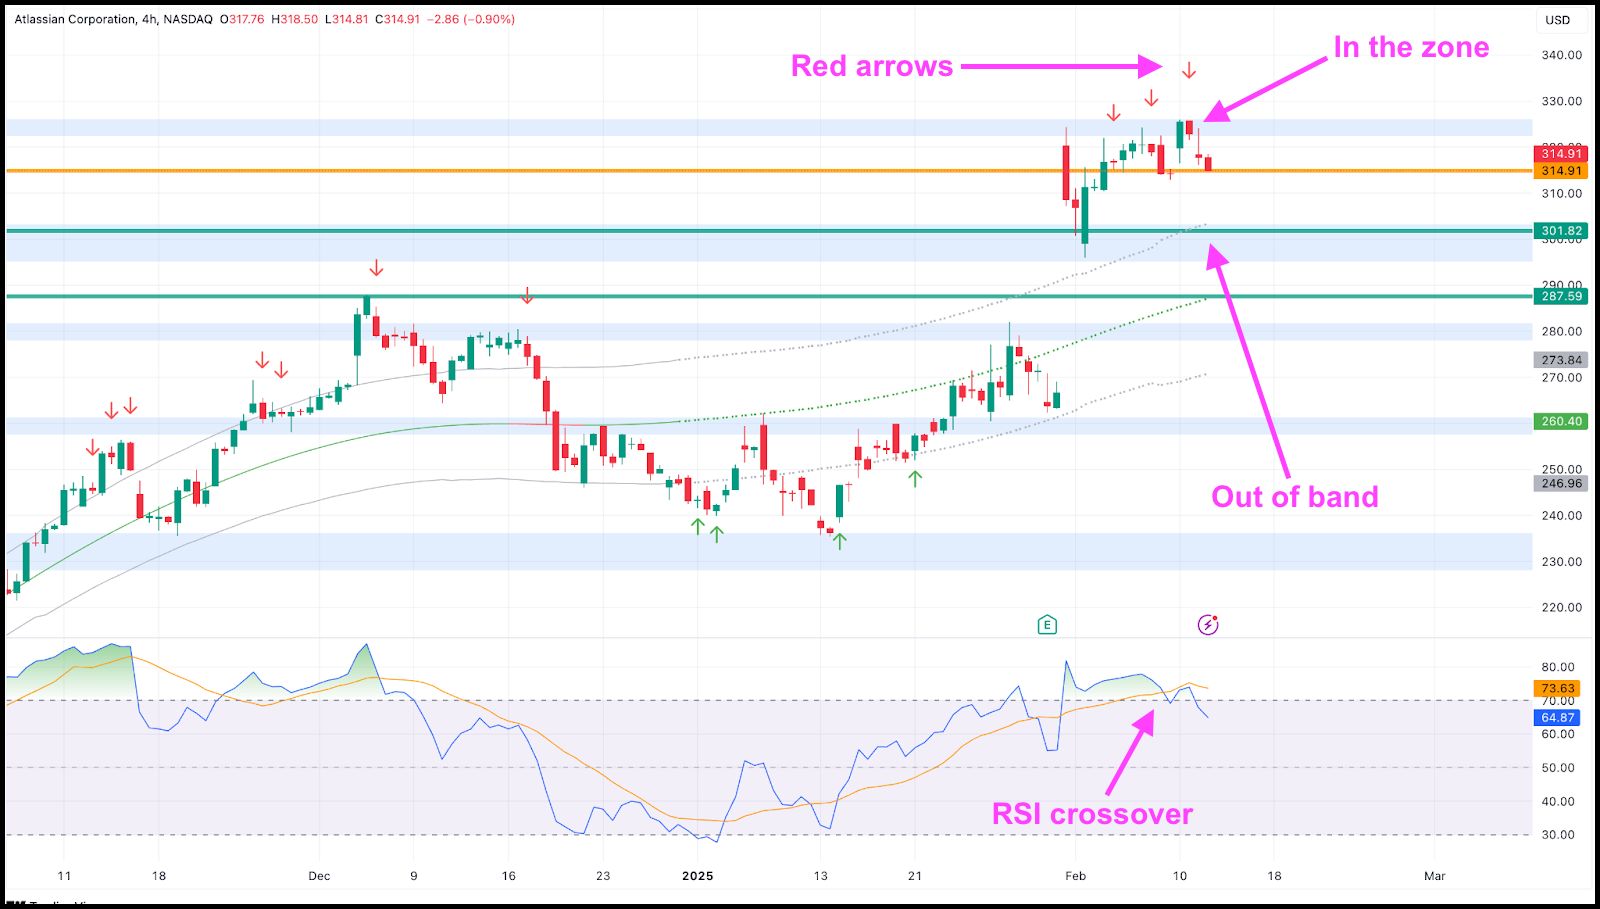
If the pressure continues, we could see sellers take control.
A break below key levels could accelerate the drop.
🎯 Targets:
Sell: $314.91
TP1: $301.82
TP2: $287.59
Automatic Data Processing (NASDAQ: ADP)
ADP isn’t waiting around - it’s already broken both its trendline and RSI support, confirming that momentum has shifted.
There is no better call than a sell position at $305.87 now.
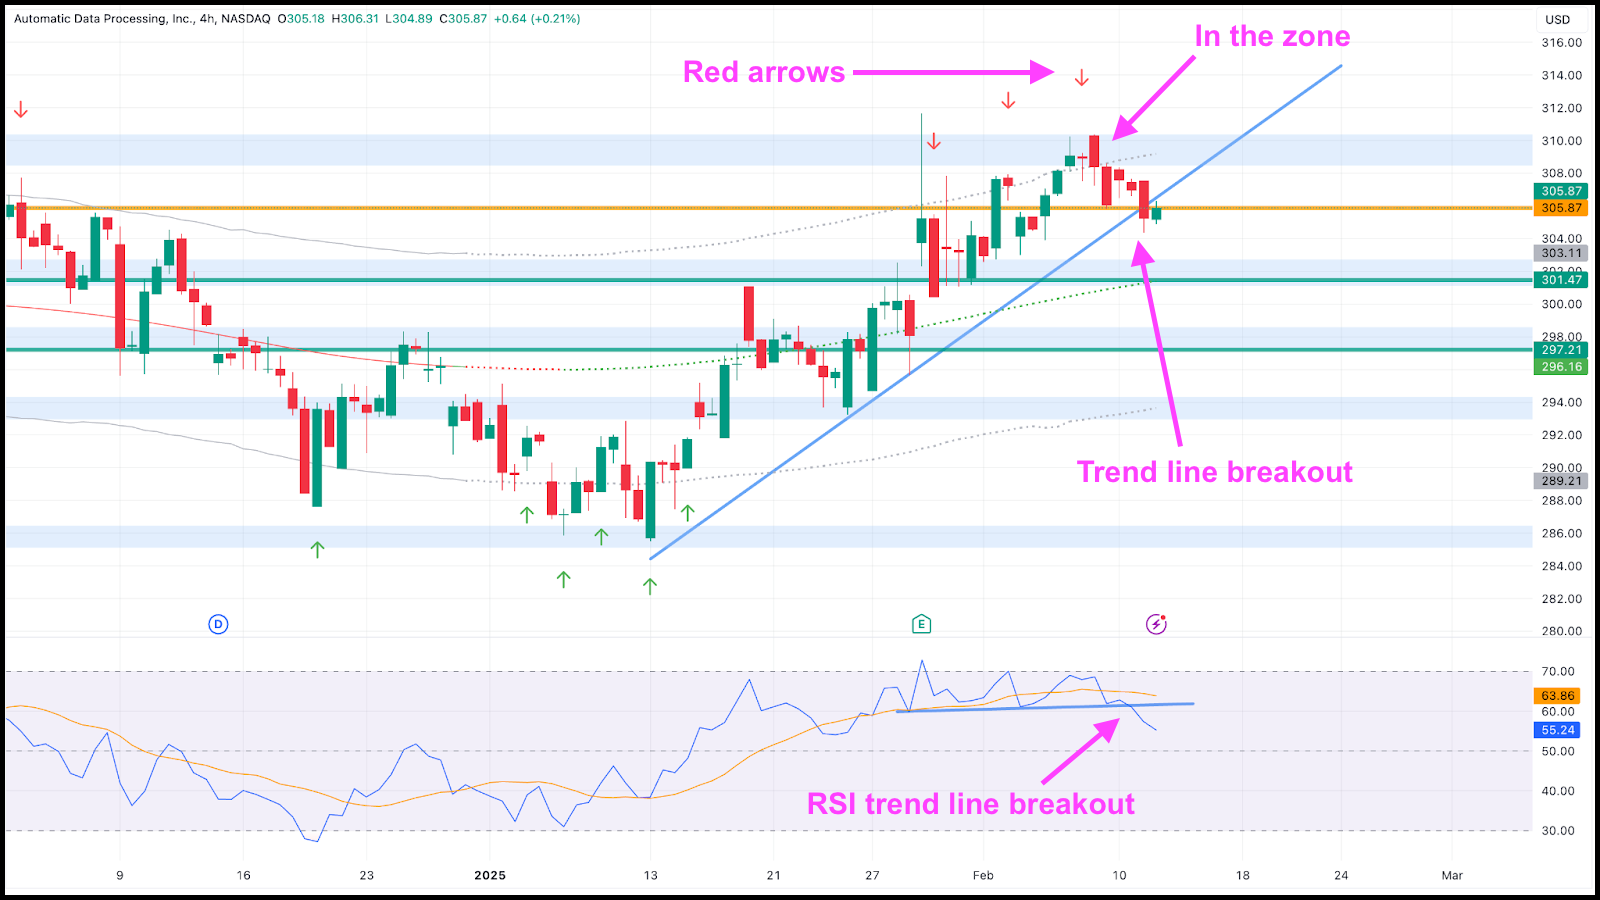
When multiple signals align like this, the downside move often has more conviction.
With technicals giving the green light, we’re stepping in before the next wave down.
🎯 Targets:
Sell: $305.87
TP1: $301.47
TP2: $297.21
Some trades take patience, but when the charts speak this clearly, it’s time to take action.
Buckle up - this could get interesting.

Think Technical Analysis Is Just Fancy Doodles? Here’s How to Make Sense of It!
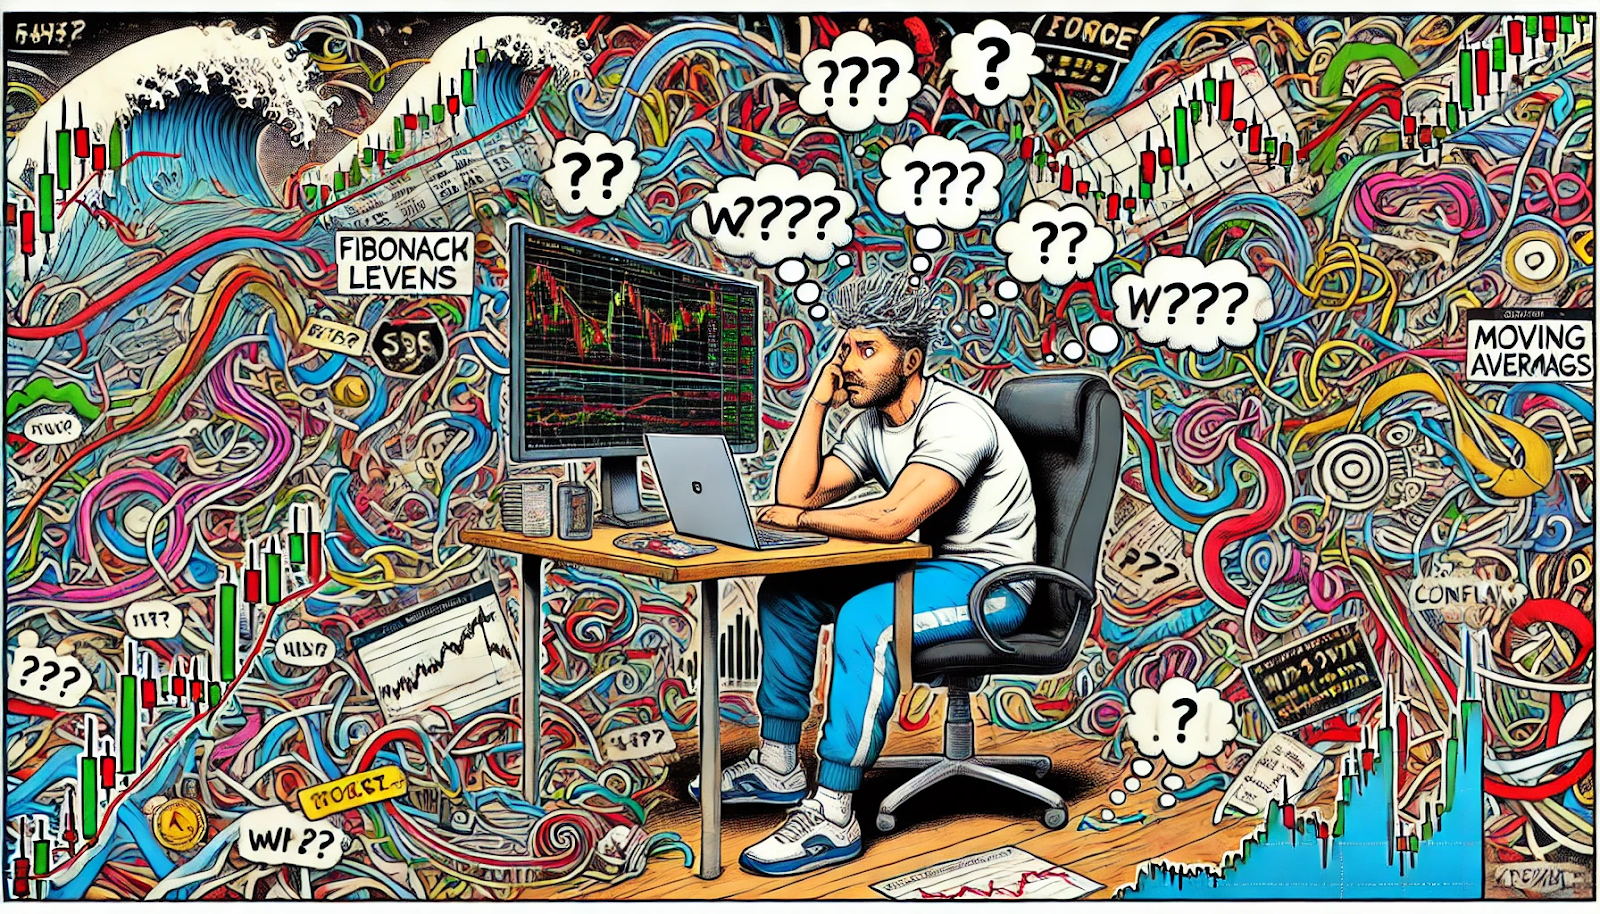
If you’ve ever looked at a trading chart and felt like you were staring at an abstract painting, you’re not alone.
Candlesticks, moving averages, RSI, Fibonacci levels.
It can all look like a tangled mess of lines and numbers, making trading seem way more complicated than it actually is.
Many beginners never take the first step because they assume they’ll never understand all the jargon and technical indicators.
That’s exactly why these newsletters are so valuable.
They break down technical analysis into simple, easy-to-follow explanations so you can understand the charts without feeling overwhelmed.
Instead of getting lost in complex terminology, you’ll learn how to read patterns, spot opportunities, and use key indicators without the confusion.
Whether you’re a complete beginner or just looking for a way to simplify your strategy, these newsletters strip away the unnecessary fluff and focus on what actually helps you trade smarter.

Moving Average Envelope
Moving Average Envelopes are technical analysis indicators that create bands around a moving average of the price.
These bands, typically set at a fixed percentage above and below the moving average, help traders identify potential overbought or oversold conditions, as well as potential trend reversals.
What to Look For:
- Overbought/Oversold Conditions:
- When the price moves above the upper band, it may be considered overbought, suggesting a potential price correction.
- When the price moves below the lower band, it may be considered oversold, suggesting a potential price rebound.
- Trend Confirmation:
- Price movements within the envelope can be seen as a continuation of the existing trend.
- Breakouts above the upper band or below the lower band can signal a potential change in trend direction.

The Billionaire Who Bet Different

Imagine turning $1,700 into $5 billion - tax-free.
That’s Peter Thiel, a chess prodigy turned master investor.
In 1999, Thiel bought 1.7 million PayPal shares inside his Roth IRA for just $1,700.
When eBay acquired PayPal in 2002, he walked away with $55 million.
But he didn’t stop there.
In 2004, he bet $500,000 on Facebook when it was just a startup, turning it into $638 million when Facebook went public.
ithout adding another dime, he reinvested, growing his Roth IRA to $5 billion by 2019.
His strategy?
Spot undervalued opportunities, think long-term, and ignore the crowd.
Whether backing Facebook early or supporting Trump in 2016, Thiel plays chess, not checkers.

So ask yourself;
Are you playing the game, or just reacting to the moves?