HSBC Hit By Legal Blow
....................................................................................................................


Good morning, midweek movers.
Markets are steady but charged with anticipation as Wall Street braces for the Fed’s big decision day after another record-breaking session.
Futures are mixed, with the Dow slightly lower, while the S&P 500 and Nasdaq tick higher, building on Tuesday’s surge that sent all three indexes to fresh highs. The S&P briefly crossed 6,900 for the first time, edging closer to that psychological 7,000 milestone.
Tech is once again carrying the torch. Nvidia closed at a new record and kept climbing after hours, rolling out fresh AI partnerships with Uber, Eli Lilly, Oracle, Cisco, and T-Mobile - a clear signal that its dominance in the AI arms race is only growing.
Investors now turn to Jerome Powell and the Fed, where a quarter-point rate cut is almost certain. But the real story will be what Powell says next. Traders are hungry for clues about how deep this easing cycle might run.
Meanwhile, optimism around Trump’s upcoming meeting with Xi Jinping is keeping global sentiment afloat, with hopes of a genuine trade thaw on the horizon.
It’s a loaded midweek lineup. Big Tech earnings are coming in hot — Alphabet, Meta, and Microsoft report after the bell, followed by Apple and Amazon tomorrow. Add in fresh oil moves and OPEC chatter, and this session could turn lively fast.
Next up, we’re diving into The Crucial Update, where today’s trending stories are shaking up the market narrative.

📉 HSBC Profit Plummets on $1.1 Billion Madoff Charge, But Outlook Rises
A costly legal blow tied to the Bernie Madoff scandal tanked HSBC's quarterly profit, yet the bank is confidently raising its full-year income forecast, showing underlying strength.
🚀 Qualcomm Stock Explodes 23% on New AI Challenge to Nvidia and AMD
Qualcomm just entered the $6.7 trillion data center battleground with two new AI chips designed to run models faster and cheaper than the current kings, sending its stock soaring.
🐂 SoFi Stock Closes at New Peak Ahead of Q3 Earnings Test
Retail traders "extremely bullish" and Wall Street betting on a strong quarter, all eyes are on SoFi’s Q3 report. But can the finance disruptor justify its sky-high valuation?
📉 Wall Street Slaps Buffett's Berkshire with a Rare 'Sell' Signal
The "Buffett Premium" is fading. A major brokerage downgraded Berkshire Hathaway due to succession uncertainty and a "perfect storm" of pressure facing its core businesses like Geico and BNSF.
🎯 BTC Eyes Record Monthly Close as AI Predicts $125,000 Target
Bitcoin is charging toward its highest monthly close ever, fueled by optimism over macro tailwinds and a bullish AI forecast. Is this the breakout moment the crypto market has been waiting for?
🪙 Gold's Record Rally Pauses: Consolidation Forecasted Until 2026
After surging by over 55%, the yellow metal is now in a long consolidation phase, with analysts predicting the next major upward leg may not begin until 2026.
⏸️ Global Markets Hold Breath as Trump, China, and Earnings Collide
Global stocks see mixed results as investors weigh the potential impact of Trump's looming meeting with the Chinese leader against a busy week of corporate earnings reports.

📣 We’re Back In The Game! 🎯
The pause wasn’t a break.
It was a recalibration.
Over the past few weeks, we’ve been sharpening our precision, refining our entry criteria, and tightening our timing so that every setup we take is worth the move.
And today, we are ready to recommend setups again!
Charles River Laboratories International, Inc. (NYSE: CRL)
After that strong rally, CRL is showing clear signs of exhaustion.
Price has pushed into our AV SNR zone, red arrows have appeared, and RSI has just crossed down.
Confirming momentum loss.
This is a classic setup where buyers start running out of steam, and sellers quietly take control.
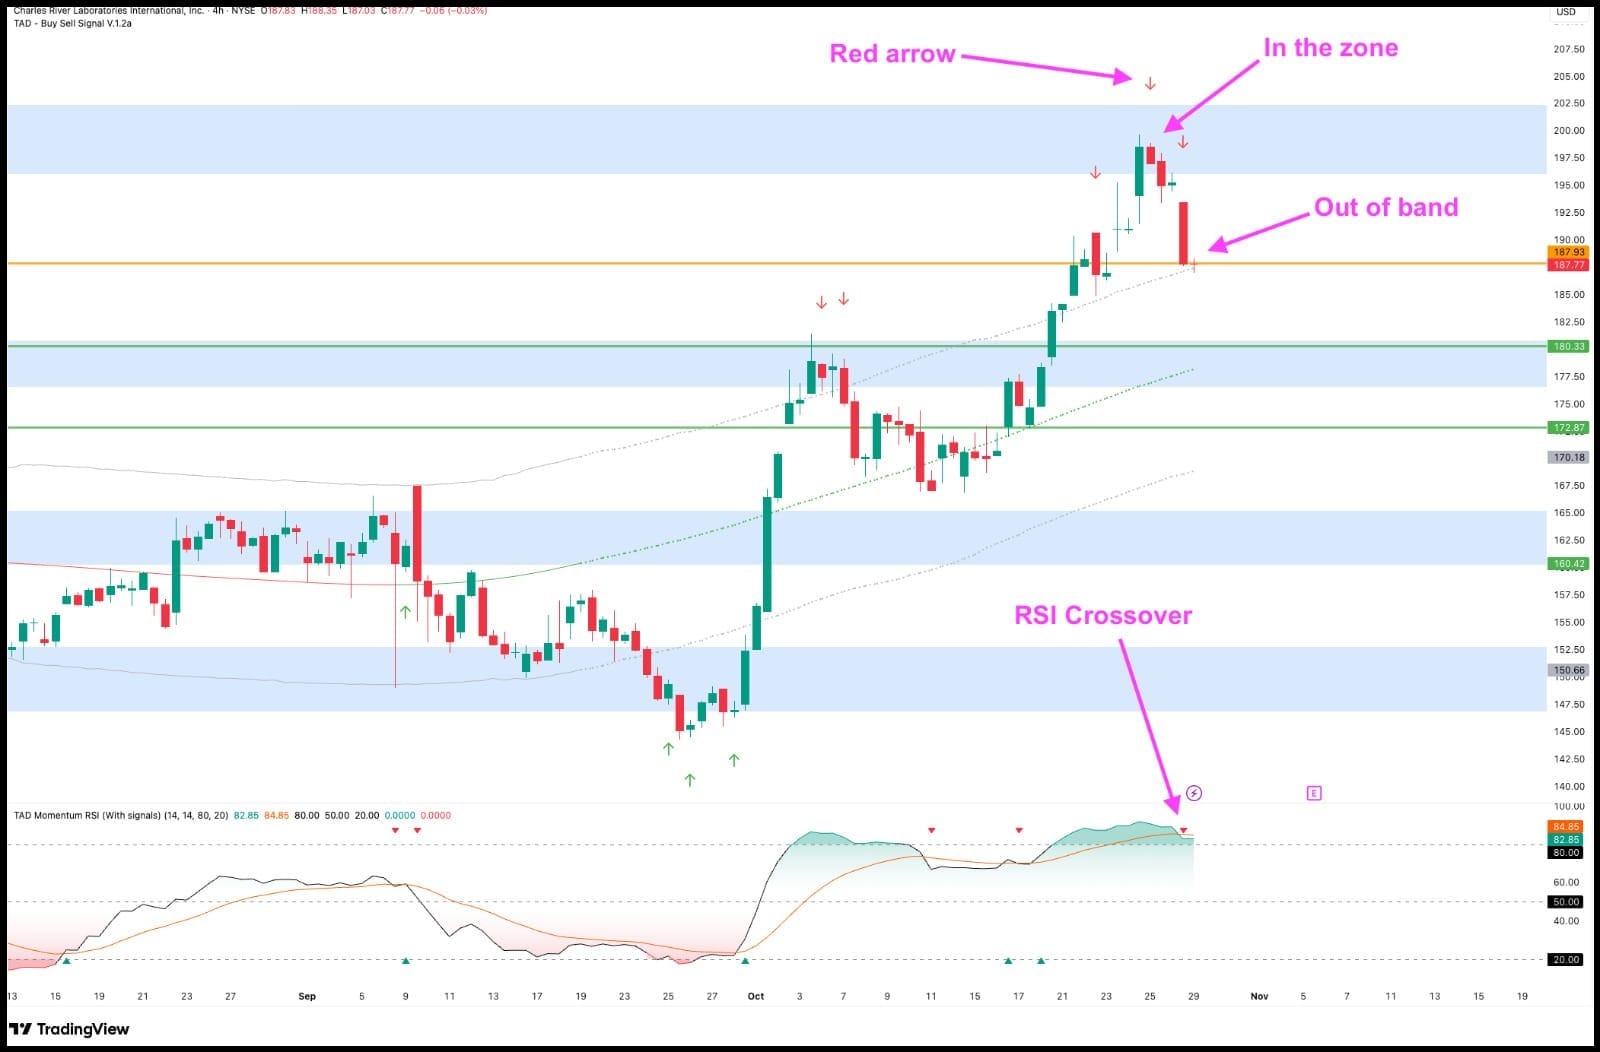
🎯 Targets:
Sell: $187.93
TP1: $180.33
TP2: $172.87
It’s time to catch the turn before the crowd sees it.
Black Hills Corporation (NYSE: BKH)
Price has been climbing beautifully… but all good runs need a breather.
BKH is now in the zone, out of band, and printing red arrows.
Perfect situation for a potential reversal.
RSI crossover adds the final piece of confirmation we needed.
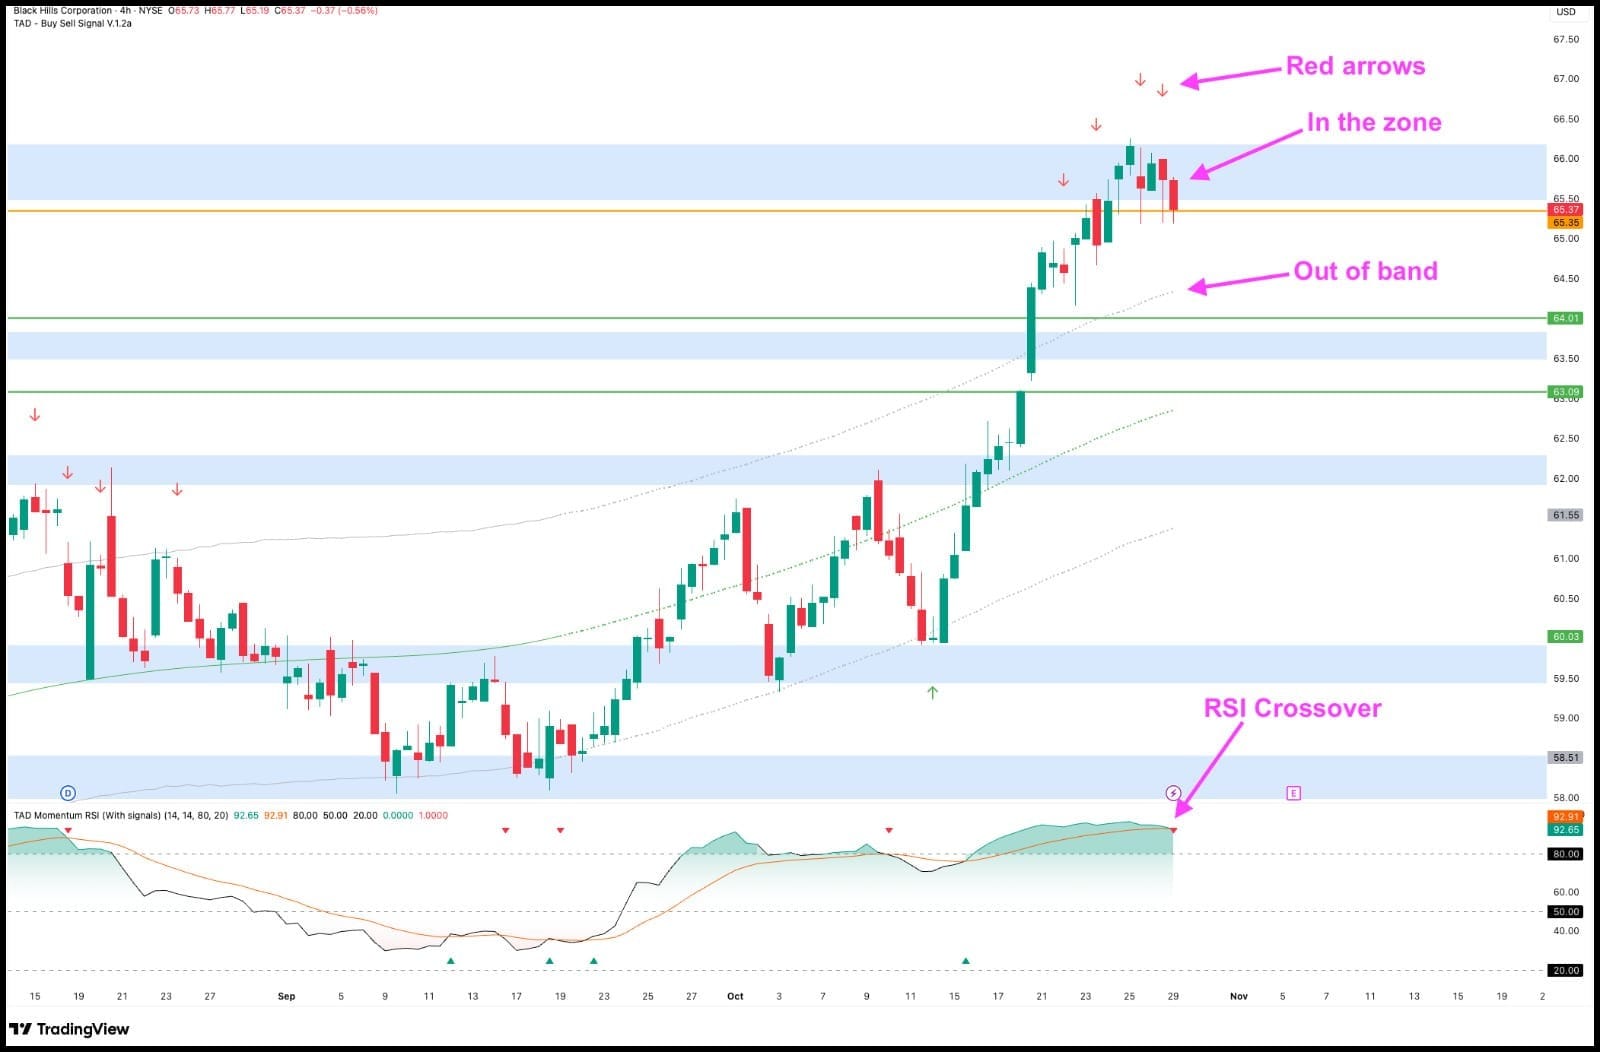
🎯 Targets:
Sell: $65.35
TP1: $64.01
TP2: $63.09
PepsiCo Inc (NASDAQ: PEP)
Pepsi’s rally looks tired.
Price has entered our sell zone, gone out of band, and momentum is crossing down.
A classic 4C alignment that calls for a sell.
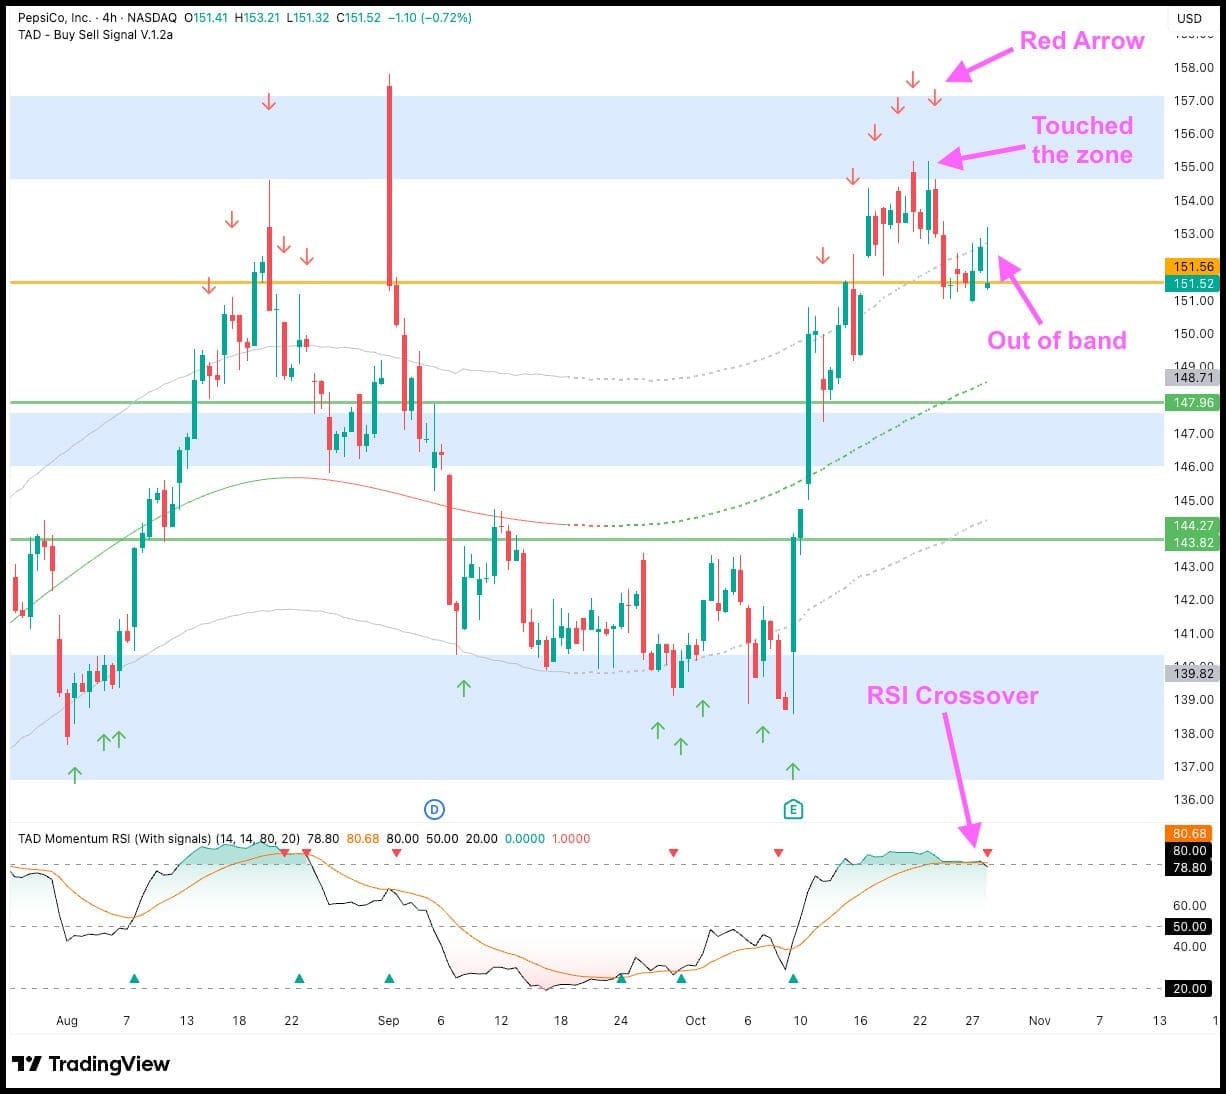
🎯 Targets:
Sell: $151.56
TP1: $147.96
TP2: $144.27
NorthWestern Energy Group (NASDAQ: NWE)
NWE climbed right into a key zone and has started rolling over.
Sellers are stepping in while momentum cools.
A perfect setup for a short at $61.71
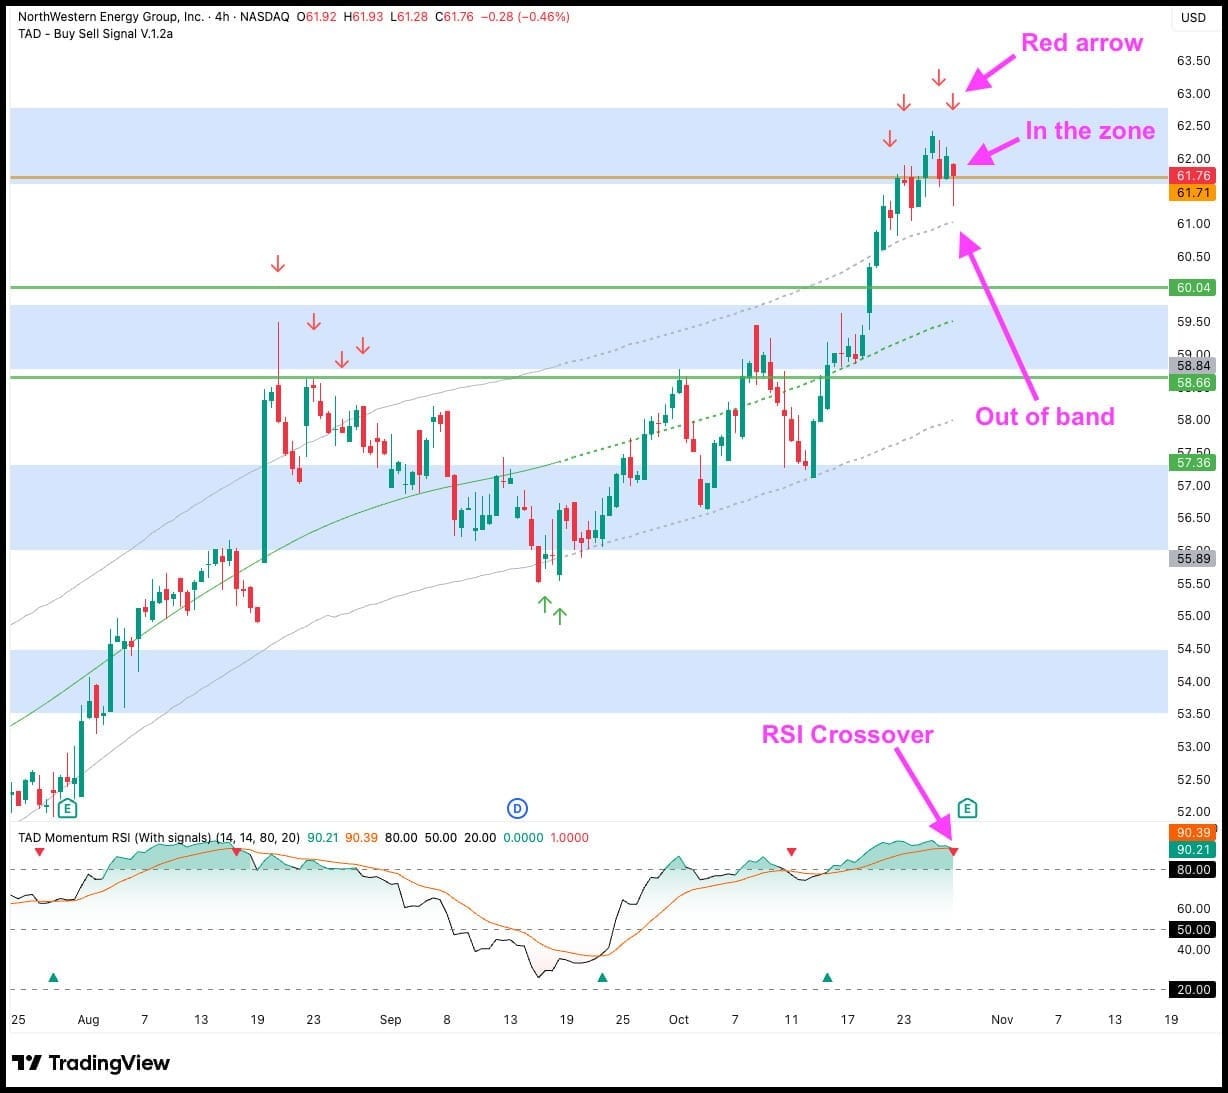
🎯 Targets:
Sell: $61.71
TP1: $60.04
TP2: $58.66
We’re stepping in right where momentum slows.
Precision, patience, and timing.

Stop Waiting Until You Can Afford Expensive Tools
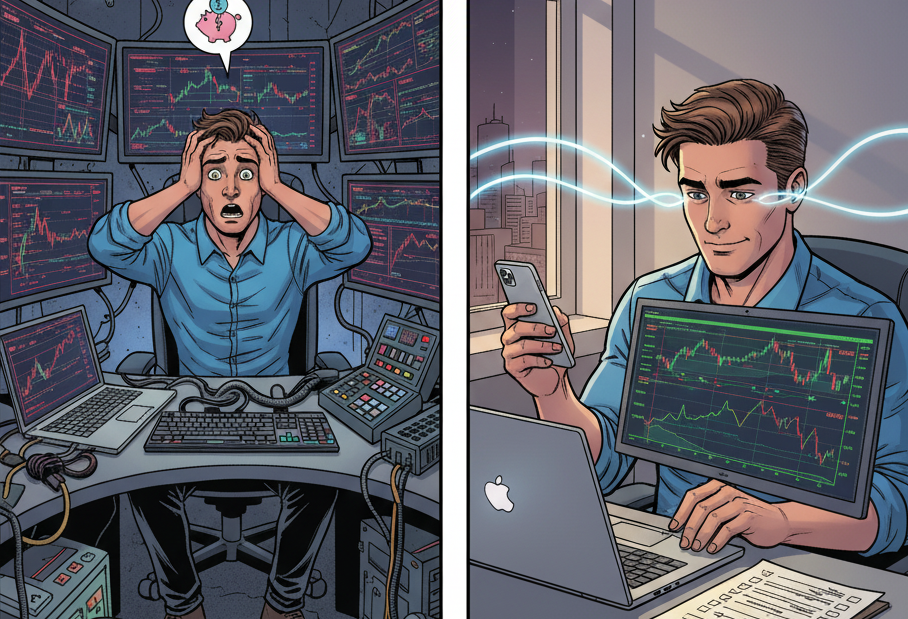
A lot of people delay trading because they think they need all the fancy stuff first - multiple monitors, paid indicators, a high-end laptop that looks like it came straight out of NASA.
But here’s the truth: none of that matters if you don’t know how to use what you already have.
You can start trading with a simple laptop or even your phone.
What actually builds skill isn’t your setup - it’s your ability to read charts, manage risk, and stay disciplined when things get shaky.
Too many people hide behind “I’ll start when I have better tools” because it feels safer than admitting they’re scared to make mistakes.
But waiting for perfect conditions is just another form of procrastination.
The traders who win aren’t the ones with the most expensive gear - they’re the ones who start with what they’ve got and learn how to make it work.
So stop waiting.
Open the charts, take small, smart trades, and let experience be your best upgrade.
👉 Want to learn how real traders start small and grow big?
Check out these newsletters on Refind - packed with practical insights, proven strategies, and real-world lessons to help you trade smarter, not fancier.

Parabolic SAR
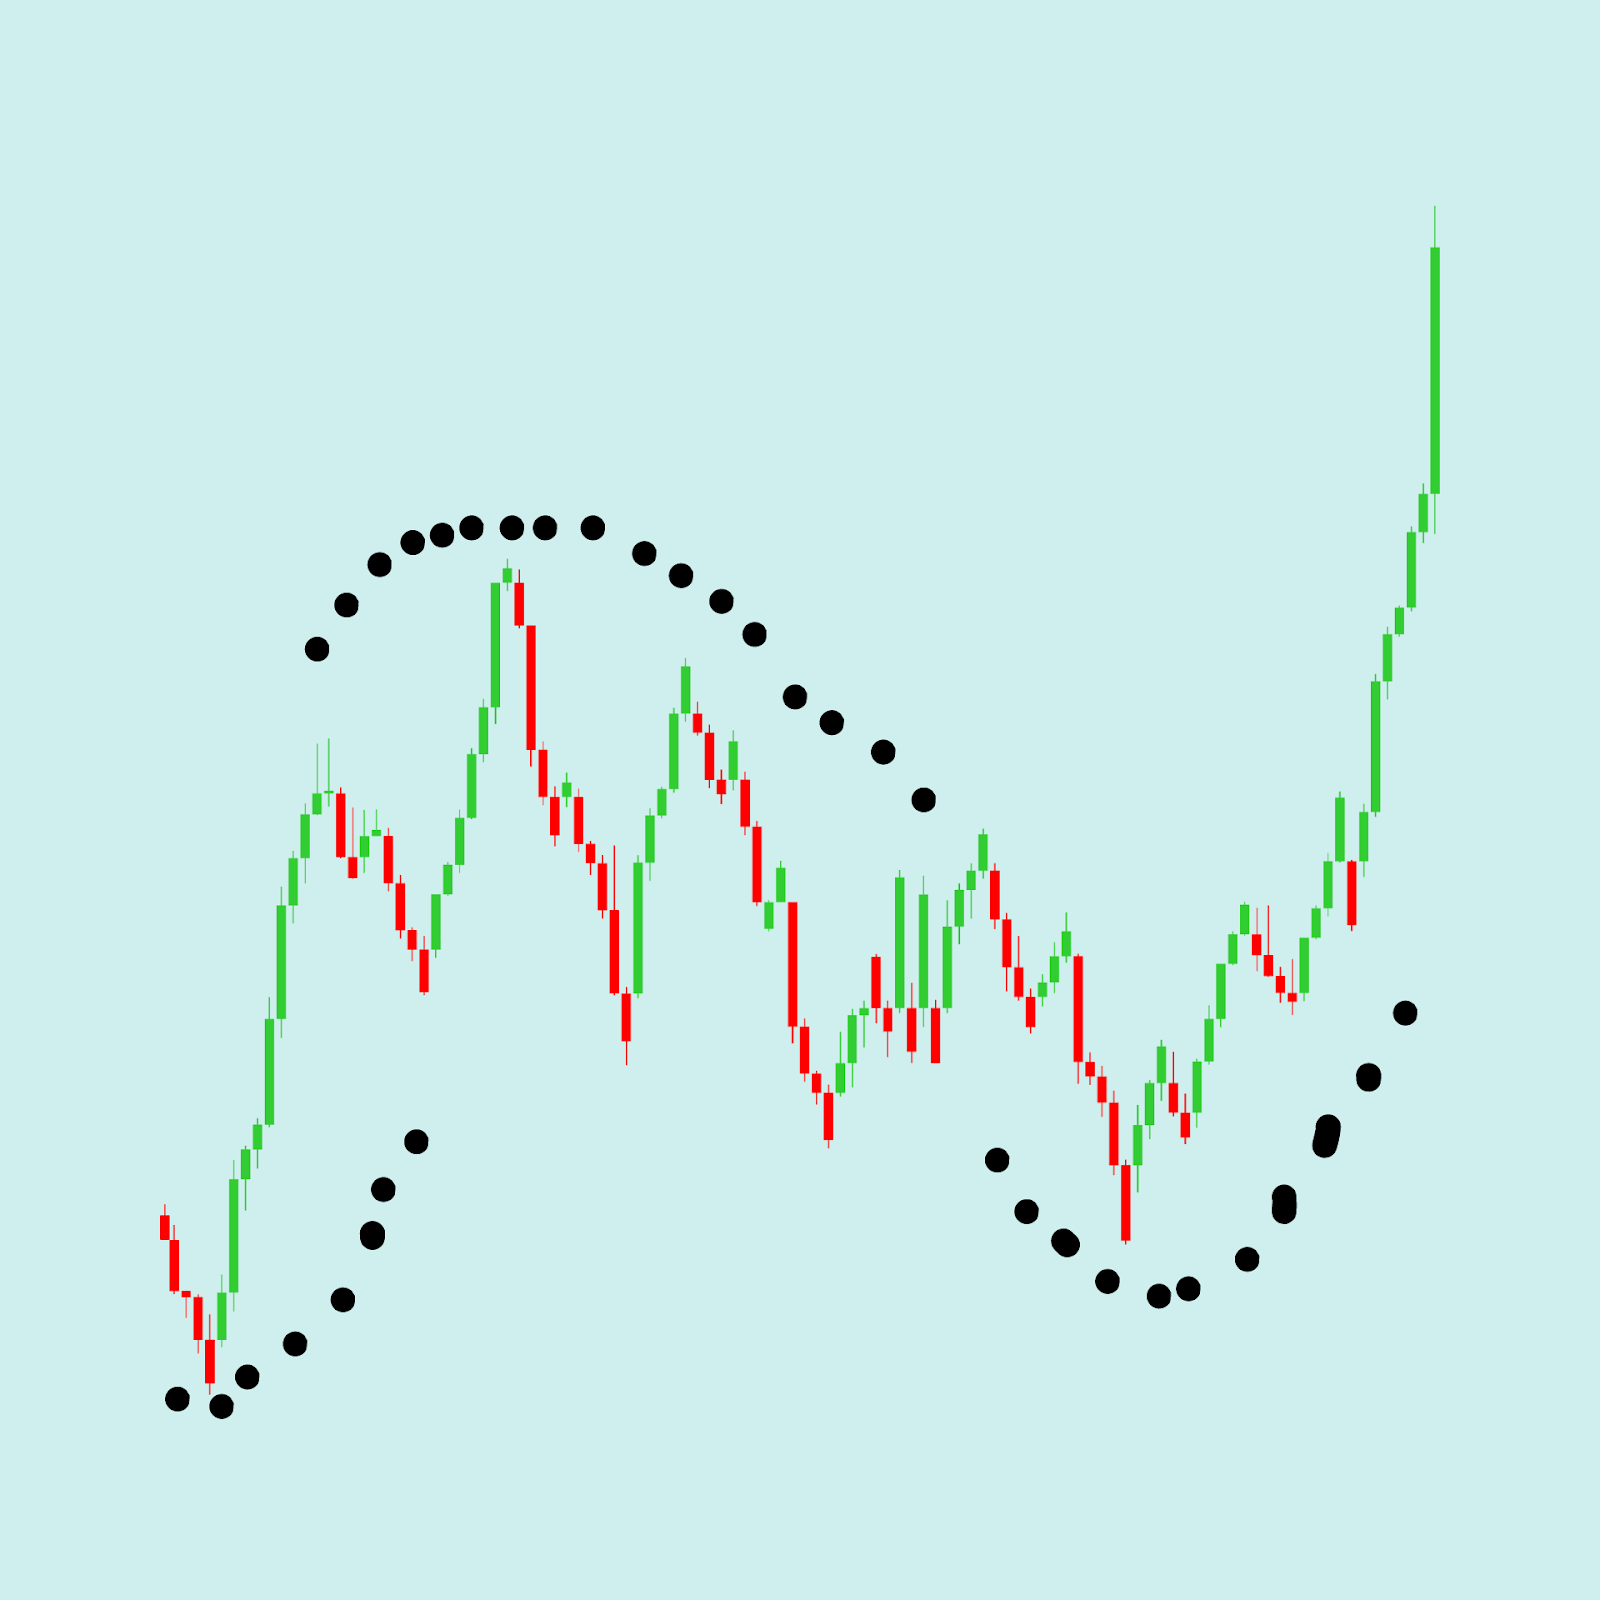
The Parabolic Stop and Reverse (SAR) is a time and price technical analysis tool developed by J. Welles Wilder Jr. It is used to determine the direction of a trend and set trailing stop-loss orders.
It is called "parabolic" because the indicator's dots, which are plotted either above or below the price bars, create a curved line resembling a parabola.
Unlike many other indicators, the Parabolic SAR is designed to always be "in the market", meaning it always provides either a long (buy) or short (sell) signal.
What to Look For (Key Features and Signals)
The Parabolic SAR is an accelerating indicator, meaning the dots accelerate (get closer to the price) as the trend matures.
- Indicator Placement:
- Dots Below Price: Signals an uptrend (bullish). Traders should be looking to be long or holding a long position.
- Dots Above Price: Signals a downtrend (bearish). Traders should be looking to be short or holding a short position.
- The Flip (Reversal Signal): The most crucial signal is when the dots flip from one side of the price to the other.
- Sell/Short Signal: When the price crosses below the dots, and the dots jump from below the price to above the price. This signals the prior uptrend has ended.
- Buy/Long Signal: When the price crosses above the dots, and the dots jump from above the price to below the price. This signals the prior downtrend has ended.
- Trailing Stop-Loss: The primary function of the indicator is to act as a dynamic trailing stop-loss.
- Once a position is entered, the current SAR dot is the recommended stop-loss level. As the trend continues, the SAR dot moves closer to the price (accelerates), locking in profits and limiting risk.
- Once a position is entered, the current SAR dot is the recommended stop-loss level. As the trend continues, the SAR dot moves closer to the price (accelerates), locking in profits and limiting risk.
- Acceleration Factor (AF): The rate at which the dots accelerate is controlled by the Acceleration Factor. This factor increases with every new high (in an uptrend) or new low (in a downtrend), causing the SAR dots to tighten their distance to the price faster as the trend continues.
- Trend Confirmation: The Parabolic SAR works best in markets with strong, persistent trends. It tends to generate frequent false signals (or "whipsaws") in sideways or ranging markets, making it essential to use in conjunction with a trend-following indicator like a Moving Average.

The Comfort Trap
Comfort is a sneaky enemy.
It creeps in quietly after a few good trades, when your setups start to feel effortless, when you think you’ve finally cracked the code.
You stop checking your risk.
You stop journaling your trades.
You start believing the market will always reward you because it has been rewarding you.
That’s how discipline fades - slowly, without you noticing.
The truth is, comfort dulls your edge.
Trading is a performance skill, not a routine job.
The moment you get too comfortable, your awareness drops.
You start entering late.
You overlook small shifts in price behavior.
You take trades out of habit, not conviction.
By the time you realize it, you’ve given back weeks of progress.
The best traders stay sharp by staying slightly uncomfortable.
They question their assumptions.
They review their trades even when they’re winning.
They know the market changes the second you think you’ve mastered it.
Progress in trading isn’t about feeling good.
It’s about staying alert.
Comfort feels safe, but it breeds carelessness.
Stay a little uneasy. Stay observant.
That tension between confidence and caution - that’s where your edge lives.