
Hitachi Soars on AI Deal
....................................................................................................................


Good morning Traders,
Wall Street’s opening the week in calm waters - but that might not last long.
Futures edged higher as the government shutdown drags into another week, with investors shrugging off Washington’s drama and staying focused on record-breaking momentum. The Dow is up 0.1%, S&P 500 +0.3%, and Nasdaq 100 leading at +0.5%.
The market mood? Quiet confidence.
Last week’s rally still has legs, and traders seem unfazed by the missing jobs report - as one strategist put it, “All news is good news, and no news matters.”
This week, eyes are on Fed speakers and the first batch of Q3 earnings (Pepsi, Delta, Levi).
And speaking of action… Hitachi just stole the spotlight.
Shares ripped 9% after striking a global AI data-center deal with OpenAI, reigniting AI-stock FOMO across the board.
The full breakdown are featured below.

🚀 Hitachi Soars on AI Deal
Shares ripped +9% after the Japanese giant inked a global data-center pact with OpenAI, fueling fresh AI-stock FOMO.
💸 Selloff Hits Tesla Stock
A strong quarter couldn’t stop bears from pouncing Tesla gave back part of its September run.
📈 Alibaba’s Hot Streak Rolls
From crackdown lows to AI darling - the stock just hit its highest since 2021.
💰 GIP Eyes $40B Buy
BlackRock’s infra arm is circling Aligned in one of the year’s biggest takeovers. If sealed, it would rank among 2025’s top five global deals.
✅ Bitcoin Reclaims $120K
Bulls charged back, pushing BTC to $120,000 for the first time since mid-August. Traders see this as the breakout moment that flips the six-week slump into a full-on rally.
🆙 Nuburu Pops 78%
Stocktwits volume exploded 1,500%, with bullish sentiment maxed at 98/100. Traders piled in, calling shorts “in shambles.”
🪙 Gold Near $4K, But Signs of Exhaustion Flash
Gold hit $3,896 an ounce this week, but RSI screaming 90 and overbought technicals suggest the rally may be running too hot.

You Don’t Need to Trade Everything to Win Something
New traders often spread themselves too thin — one day it’s crypto, the next it’s forex, then options.
They chase every shiny chart and end up mastering none.
The truth is, trading isn’t about doing it all. It’s about doing one thing well.
Pick a lane and study it until it feels familiar. Each market has its rhythm.
Once you learn to move with it, the noise fades and decisions get sharper.
Focus creates results. Distraction kills them.
👉 Start small, learn smart.
Subscribe to trading newsletters that help you find your focus.

Head and Shoulders
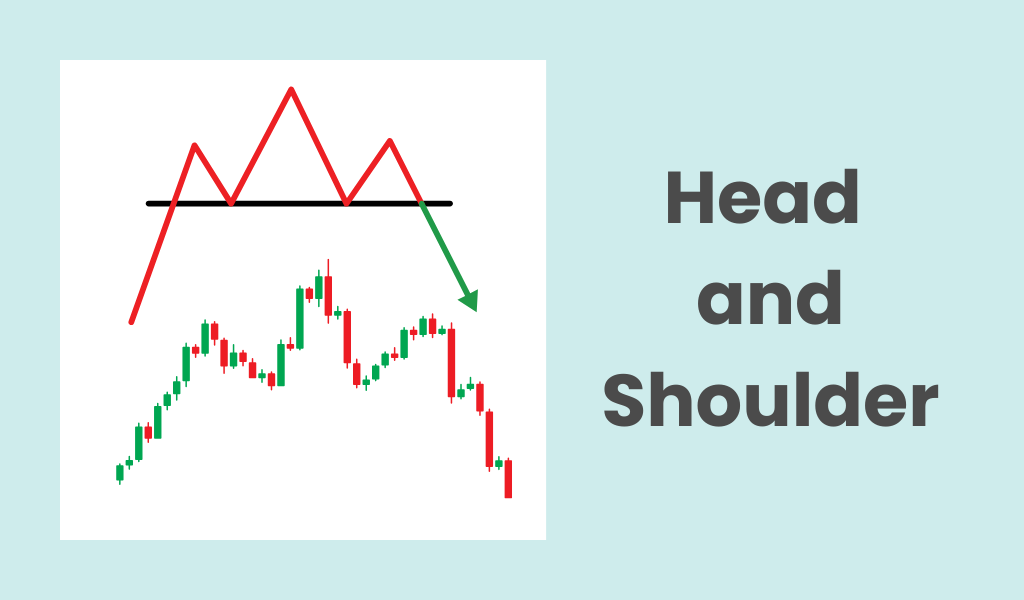
The Head and Shoulders pattern is a widely recognized and powerful bearish reversal signal in technical analysis.
It typically forms after a significant uptrend and indicates a high probability that the trend is about to reverse to the downside. The pattern's formation reflects the exhaustion of buyers and the increasing strength of sellers.
What to look for:
To correctly identify a Head and Shoulders pattern, look for the following characteristics on a price chart:
- Prior Uptrend: The pattern must be preceded by a clear and sustained uptrend for it to signal a valid reversal. It marks the high point of a rally.
- Left Shoulder: This is the first peak in the formation. The price rises to a high and then experiences a subsequent decline, usually on high volume. The peak should be followed by a slight dip.
- Head: The price rallies again to form a higher peak than the left shoulder. This peak is the highest point of the entire formation. The rally is followed by a sharp decline that brings the price back down near the level of the previous trough.
- Right Shoulder: The price rallies a third time, but this time it fails to reach the height of the Head, forming a lower peak that is roughly in line with the left shoulder. The volume on this final rally is typically lower than on the previous two peaks, signaling weakening buying conviction.
- Neckline: This is the critical support line that connects the lowest points (troughs) between the Left Shoulder and the Head, and the Head and the Right Shoulder. The neckline can be horizontal, sloping up, or sloping down, but it is typically a straight line.
- Bearish Confirmation (Breakdown): The pattern is only confirmed as a bearish reversal when the price decisively breaks and closes below the neckline after the formation of the Right Shoulder. This breakdown is often accompanied by a significant increase in volume, which confirms strong selling pressure and validates the start of the downtrend.

It’s a new trading week - fresh charts, fresh setups.
But here’s something you need to hear before you click buy or sell:
Enough of the pattern obsession.
Triangles, flags, and head-and-shoulders won’t save you if you don’t understand why price is moving.
Most traders forget that the market isn’t built to reward you - it’s built to trap you.
Those patterns you love?
Sometimes they’re bait.
Before you jump in, slow down and ask yourself:
- What’s driving this move?
- Who’s getting trapped here — buyers or sellers?
- Is liquidity being hunted?
- Are sessions or structure in your favor?
This week, trade with your mind, not your memory.
Patterns don’t make you profitable - understanding purpose does.


