Historic Drops Hit Markets
....................................................................................................................


Good morning,
Monday opened with zero chill.
US stock futures slid hard as tech names took the lead lower, rattled by AI trade nerves, collapsing precious metals, and fresh uncertainty around Trump’s pick for Fed chair.
Nasdaq 100 futures dropped 1%, dragging the S&P 500 down 0.8%, while the Dow slipped 0.6% as risk appetite thinned early.
The pressure spilled across markets:
- Gold briefly plunged nearly 10%
- Silver sank over 15%, extending Friday’s historic wipeout
- Bitcoin cracked below $80,000, sliding toward $77,000
Wall Street is stepping into a new month uneasy after Trump named Kevin Warsh as his Fed nominee, reopening the rate debate just as traders still price in two cuts by year-end.
Adding fuel to the selloff, Big Tech wobbled as doubts swirled around Nvidia and the broader AI trade — a space that’s driven both winners and wreckage so far in 2026.
All eyes now turn to a packed week ahead:
- Over 100 S&P 500 companies report earnings
- Big names include Amazon, Alphabet, Disney, Palantir, and AMD
- Friday’s jobs report is the main macro test, with payrolls expected at 65,000 and unemployment holding at 4.4%
Monday’s message is clear: nerves are high, volatility is back, and this week could set the tone for what comes next.

🥇 Gold Slides 5%, Silver Crashes 7% as Precious Metals Sell-Off Deepens
Gold and silver extended last week’s historic rout, with gold down nearly 10% on Friday and silver still reeling from a stunning 30% plunge, rattling commodity markets.
💵 Dollar Rallies as Gold and Silver Rout Hits Commodity Currencies
The U.S. dollar strengthened sharply against the Australian, New Zealand and Norwegian currencies as collapsing precious metals prices rippled through global markets.
🪙 Bitcoin Hovers Near $77,000 as Broader Downtrend Remains Intact
Bitcoin steadied around $76,000–$77,000, but strategists warned dip-buying remains muted as the crypto slides toward its fourth straight monthly loss.
🌏 Asian Stocks Slip as Metals Melt and Heavy Earnings Week Looms
Asian shares followed Wall Street futures lower as silver fell another 5%, amplifying nerves ahead of a packed week of earnings, central bank meetings and key data.
💻 Microsoft Drops Out of $3 Trillion Club After Worst Month in Over a Decade
Microsoft logged its weakest monthly performance in more than ten years, slipping below a $3 trillion market cap, even as analysts remain broadly bullish.
☁️ Oracle Plans Up to $50B Fundraise to Supercharge Cloud and AI Expansion
Oracle aims to raise $45–$50 billion in 2026 through debt and equity sales to finance massive cloud infrastructure investments driven by AI demand.
🛢️ Oil Slides Over 5% as Trump Signals Iran Talks, Easing Supply Fears
Crude prices dropped sharply after President Trump suggested progress toward talks with Iran, reducing concerns over potential supply disruptions.

The Perfect Time Never Shows Up
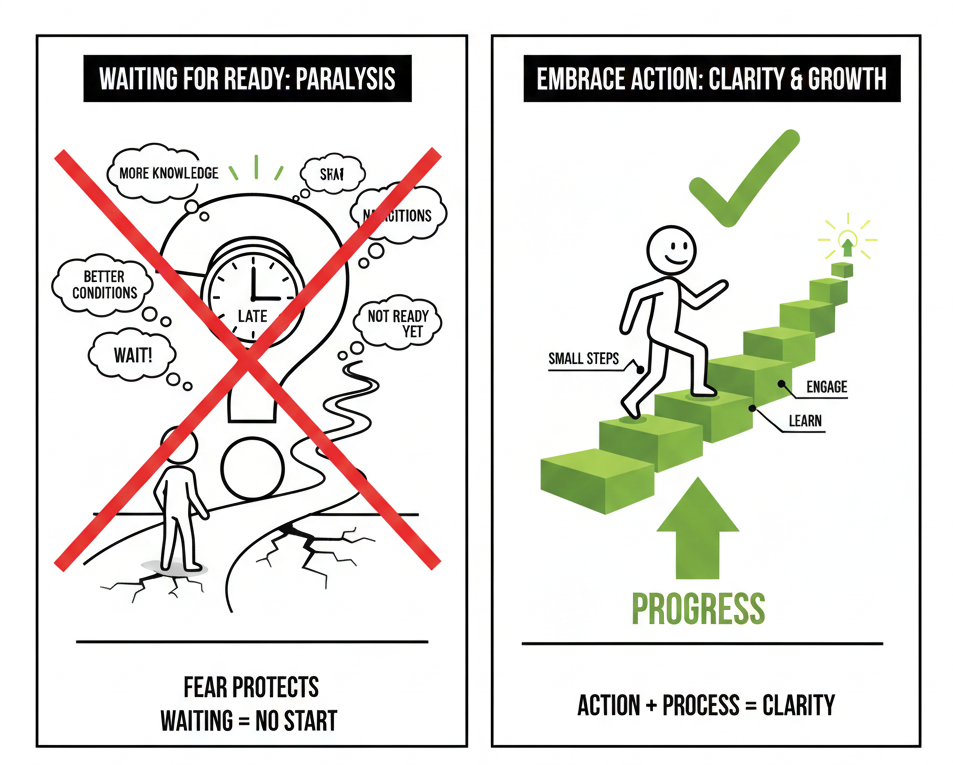
Many people delay trading because they are waiting to feel ready. More time. More knowledge. Better conditions. That moment rarely arrives.
Clarity comes from action. Understanding grows once you engage with the process. Small steps reveal what matters and what does not.
Waiting feels responsible, but it often protects fear, not preparation.
There is no perfect entry into learning. Progress begins when you start with what you have.
Momentum builds after movement, not before.
If you want guidance that helps you start with structure instead of waiting for perfection, these newsletters help. They focus on fundamentals, discipline, and steady improvement.

Hammer
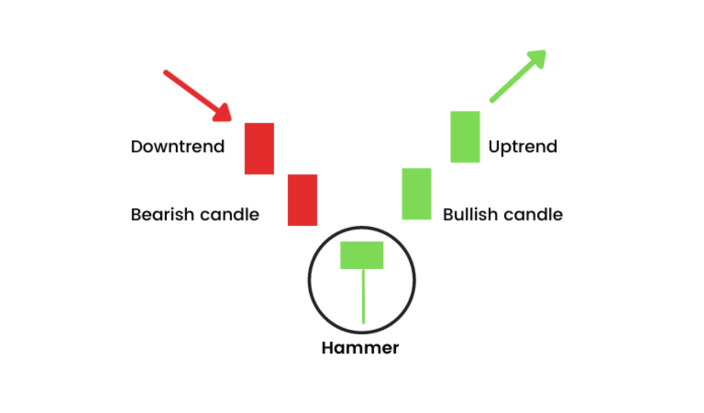
The Hammer is a single-candle bullish reversal pattern that forms at the base of a downtrend. It is named for its shape—a small body at the top with a long lower wick—representing the market "hammering out" a bottom. It shows that although sellers pushed the price significantly lower during the session, buyers flooded back in to push the price back up toward the open, creating a powerful rejection of lower prices.
🛠️ The Strategy Logic
Use these logical triggers to identify when a price floor has been established:
- IF: The lower wick (shadow) is at least two to three times the length of the candle body...
- THEN: The signal is valid. The longer the lower wick, the more significant the rejection of the bears and the stronger the potential for a reversal.
- THEN: The signal is valid. The longer the lower wick, the more significant the rejection of the bears and the stronger the potential for a reversal.
- IF: The Hammer forms after a series of at least three or more consecutive red candles...
- THEN: The reversal probability increases. A Hammer needs a prior downtrend to "reverse"; without a decline, it is simply a neutral candle in a sideways market.
- THEN: The reversal probability increases. A Hammer needs a prior downtrend to "reverse"; without a decline, it is simply a neutral candle in a sideways market.
- IF: The price "gaps" down at the open before forming the Hammer...
- THEN: You have a "selling climax" signal. This shows that the final bears panicked and sold at the open, only to be immediately absorbed by "smart money" buyers.
- THEN: You have a "selling climax" signal. This shows that the final bears panicked and sold at the open, only to be immediately absorbed by "smart money" buyers.
- IF: The next candle after the Hammer closes above the Hammer's body...
- THEN: The reversal is confirmed. This is the safest entry point, as it proves that the buying momentum seen in the wick is actually carrying over into the next session.
- THEN: The reversal is confirmed. This is the safest entry point, as it proves that the buying momentum seen in the wick is actually carrying over into the next session.
- IF: The Hammer forms exactly at a Lower Keltner Channel or a major support line...
- THEN: This is a high-conviction "Confluence" trade. The technical level provides the reason for the bounce, and the Hammer is the visual proof that the bounce is happening.
💡 Pro Tip
Color Doesn't Rule: While a green (bullish) Hammer is technically stronger because the price closed higher than it opened, a red Hammer is still a valid bullish signal. The most important part of this pattern is the length of the lower wick, not the color of the tiny body. The wick tells the story of the rejection, which is the "force" that drives the reversal.

The Silent Rule Break

This is how discipline usually disappears.
Nothing explodes. Nothing feels urgent. You bend one rule. You move a stop a little.
You take a setup that is close enough. You tell yourself it does not matter.
The market stays quiet. No punishment shows up. That silence feels like permission.
So the exception becomes repeatable. Then normal.
Rules stop feeling firm. They start feeling flexible.
You still believe you are trading the plan, but the plan has already shifted under your feet.
Risk creeps higher. Losses linger longer. Wins stop covering mistakes.
Accounts rarely die in one emotional moment.
They decay through small, calm decisions made without friction.
Each quiet rule break weakens the structure that protected you when conditions turned ugly.
Strong traders pay attention when things feel easy.
They review trades after green days. They treat every exception as information, not convenience.
The danger is not panic trading.
The danger is calm rule breaking that teaches you the wrong lesson while the market waits.